Figures & data
Figure 1. Photomicrographs of paraffin sections in the hippocampus. (a & b) show hippocampus proprius, dentate gyrus (dg) and subiculum (SC); (HF: hippocampal fissure, CA: cornus amonis, blades of DG (white arrows), crest (black arrow heads (H&E, ×40). (c) shows layers of the hippocampus; alveus (al), stratum oriens (st.Or), stratum pyramidale (st.Py) and stratum radiatum (st.Rd); (neuroglial cells (white arrow heads), nerve fibers (asterisks), scattered nuclei (black arrow heads), pyramidal cells (white arrows), radial fibers (wavy arrows) (H&E, ×100). (d) shows CA3 region (H&E, ×100) and the inset shows a higher magnification of pyramidal cells (white arrows) with vesicular nuclei (N), apical dendrite (arrow head) and basal dendrites (round shape) (H&E, ×400). (e) shows layers of the DG; the molecular layer (MoL), the granule cell layer (GrL) and the polymorphic layer (PoL); (pia matter (pia), blood vessels (black arrow heads), scattered nuclei (arrow heads), nerve fibers (asterisks), granule cells (white arrows), immature cells (tailed arrows), the subgranular zone (sub) (H&E, ×100). (f) shows a higher magnification of granule cells (white arrows) with vesicular nuclei (N). Spindle-shaped immature cells (tailed arrows) appear in the subgranular zone (H&E, ×400).
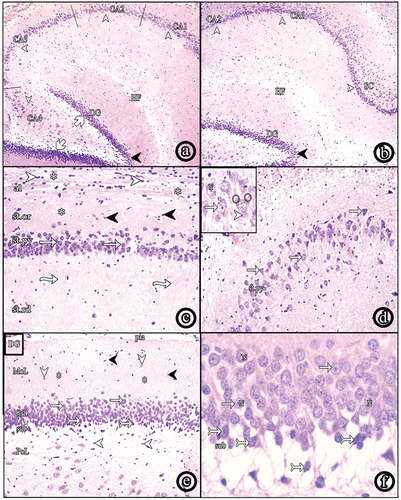
Figure 2. Photomicrographs of paraffin sections in CA3. (a) Group II shows numerous shrunken darkly stained pyramidal and neuroglial cells. (b) Group III and (c) Group IV show decreased shrunken pyramidal and neuroglial cells. (d) Group V reveals very few shrunken pyramidal cells with increased number of normal ones. Also, neuroglial cells decreased in number (H&E, ×100). (e) a higher magnification of the diabetic group (Group II) and (f) a higher magnification of insulin and Cbl-treated group (Group V) (H&E, ×400); (shrunken pyramidal cells (white arrows), normal pyramidal cells (wavy arrows), neuroglial cells (arrow heads), focal areas of cell loss (asterisks), vesicular nuclei (N).
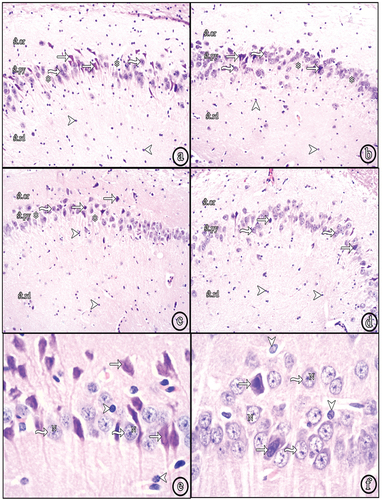
Figure 3. Photomicrographs of paraffin sections in the DG. (a) Group II (diabetic group) shows numerous shrunken darkly stained granule cells. (b) Group III (insulin-treated group) and (c) Group IV (Cbl-treated group) show an apparent decreased number of shrunken granule cells. (d) Group V (insulin- and Cbl-treated group) shows no shrunken cells. Immature cells are seen in the subgranular zone (sub); (normal granule cells (white tailed arrows), shrunken granule cells (black arrows), vesicular nuclei (N), immature cells (black tailed arrows) (H&E, ×400).
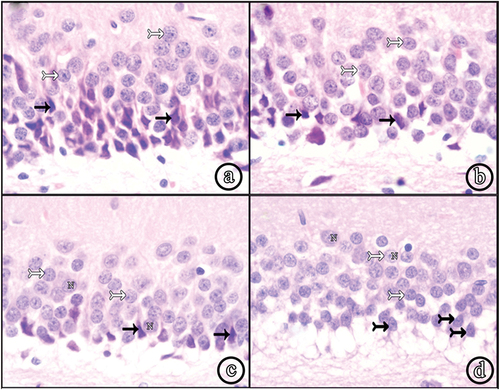
Figure 4. Photomicrographs of paraffin sections in CA3 region showing Bax, TNF-α, synaptophysin and GFAP immune reactions; Positive reactions (arrow heads) (Power × 100). According to Bax and TNF- α immunostains; Group I (control group) shows -ve immune reaction. Group II shows numerous +ve immunostained cells. Group III (insulin-treated group) and Group IV (Cbl-treated group) shhow a decrease in the number of immunoreactive cells and in Group V (insulin- and Cerebrolysin-treated group) almost all cells appear -ve immunostained. In synaptophysin stain, +ve reaction of presynaptic terminals is seen in the form of coarse beaded granules at surfaces of pyramidal cells and at their apical dendrites. Group II shows markedly decreased immunoreactivity. Group III and Group IV show a moderate decrease and Group V shows a marked decrease in number of labeled astrocytes.
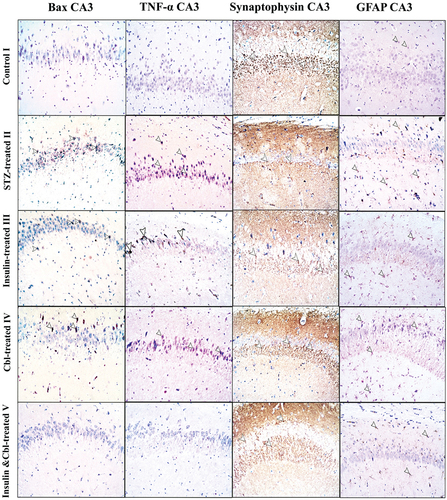
Figure 5. Photomicrographs of paraffin sections in DG showing Bax, TNF-α, synaptophysin and GFAP immune reactions; Positive reactions (arrow heads) (Power × 100). According to Bax and TNF-alpha immunostains; Group I (control group) shows -ve immune reaction. Group II shows numerous +ve immunostained cells. Group III (insulin-treated group) and Group IV (Cbl-treated group) show a decrease in the number of immunoreactive cells and Group V (insulin- and Cerebrolysin-treated group) shows a marked decrease in immunoreactivity compared to the diabetic group. In synaptophysin stain, +ve reaction of presynaptic terminals is seen in the form of coarse beaded granules at surfaces of granule cells in the granule cell layer and in hilus fasciae dentate. Group II show a markedly decreased immunoreactivity. Group III and Group IV show a mild increase in immunoreactivity and Group V show a marked increase in immune reaction compared to the diabetic group. GFAP immunoreaction in Group I shows few small sized astrocytes with thin short processes. Group II shows a marked increase in labeled astrocytes. Group III, Group IV and Group V show a moderate decrease in number of labeled astrocytes compared to the diabetic group.
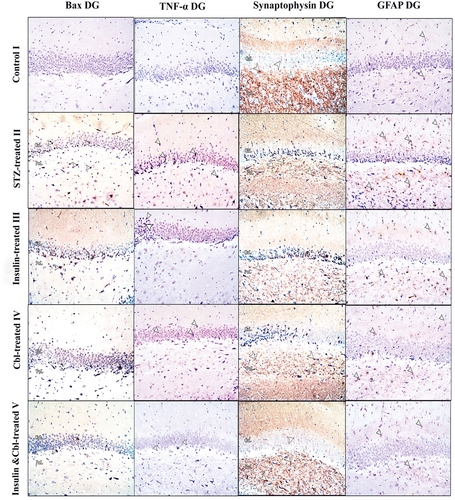
Figure 6. Representative histograms: (a) The mean body weight in different groups. (b) The mean fasting blood glucose level (BGL) in different groups. (c) The mean thickness of St.Py in CA3 and GCL in DG in different groups. (d) The mean number of pyramidal cells in CA3 and granule cells in DG of different groups (SD: standard deviation). *a: siginificance versus control group. *b: significance versus diabetic group. *c: significance versus insulin-treated group. *d: siginificance versus Cbl-treated group.
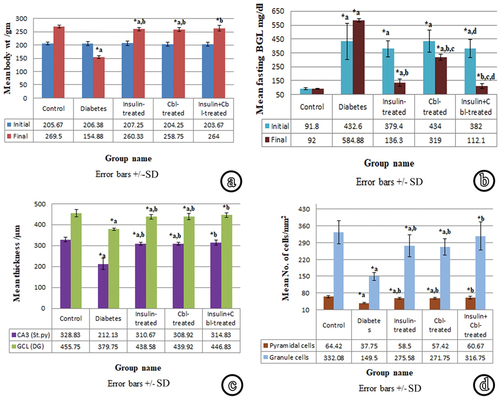
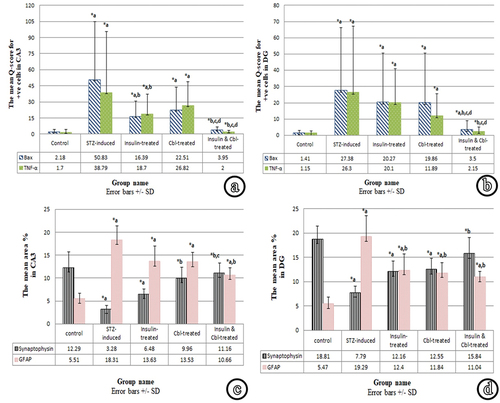
Figure 7. Representative histograms: (a) The mean Q-score of Bax and TNF- α expression in CA3 in different groups. (b) The mean Q-score of Bax and TNF-α expression n DG in different groups. (c) The mean area % of synaptophysin and GFAP reactions in CA3 in different groups. (d) The mean area % of synaptophysin and GFAP reactions in DG in different groups (SD, standard deviation). *a: sigificance versus control group. *b: significance versus diabetic group. *c: significance versus insulin-treated group. *d: significance versus Cbl-treated group.