
Figures & data
Table 1. Body weight, fasting insulin, serum triglyceride and total cholesterol (TC).
Figure 1. Panel (a) shows a graphical representation of the effect of STZ administration on the blood glucose levels of experimental rats and the resultant effect on the rats when the YLE and MLE 200 mg/kg was administered. There was a significant increase (P < 0.05) in the blood glucose levels of the diabetic control when compared to normal, and there was a significant decrease (P < 0.05) in blood sugar level of the treated groups when compared to the diabetic group. The values are given as mean ± standard deviation of replicate determinations (n = 6).
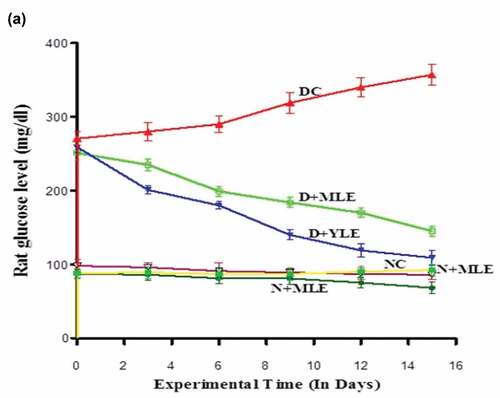
Figure 2. FTIR spectra of ethanolic extract of Azadirachta indica leaf, showing different spectra and each peak corresponding to a particular functional group.
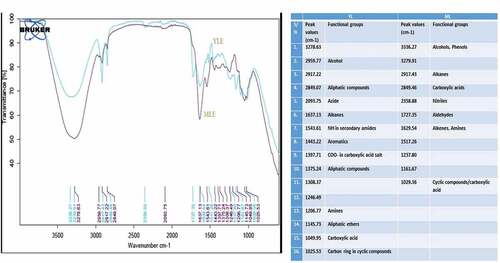
Figure 3. Panel (a) represents the results of the reduced glutathione (GSH) level in normal, experimental groups of Wistar rats. The GSH level was significantly (P < 0.05) increased in STZ-induced diabetic group of rats in comparison to the control group. The oral administration of the AI extract at a dose of 200 mg/kg body weight up to 28 days significantly (P < 0.05) decreased GSH level compared to diabetic control group. Values are given as mean ± SD for 6 rats in each group. b) Plasma membrane redox system values in normal and experimental groups. STZ-induced diabetes resulted in significantly (P < 0.05) increase level of PMRS compared to normal control groups. The oral administration of AI extract (200 mg/kg body weight) up to 28 days per day significantly (P < 0.05) decreased level of PMRS in STZ-induced diabetic rats. Values are expressed as mean ±SD for 6 rats in each group. c) Lipid peroxidation as malonaldehyde (MDA) levels in normal and experimental groups. The MDA levels of STZ-induced diabetic rats were significantly higher (P < 0.05) when compared with the normal control rats, however. Oral administration of AI extract offered significantly (P < 0.05) decreased in MDA level in diabetic rats. para. d) Total antioxidant capacity of plasma measured in terms of FRAP value the experimental rats. FRAP value is expressed as µmol Fe(II) per l of plasma. Data are represented as mean ± SD (n = 6). Significant (P < 0.05) difference was obtained between the normal and STZ-induced diabetic rats.
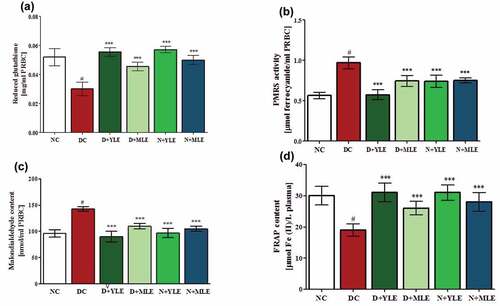
Figure 4. a) Sialic acid content in plasma in ethanolic AI leaf extracts treated STZ- induced diabetic rats. The level of sialic acid was significantly higher in diabetic rats in comparison with normal control. Significant (P < 0.05) difference was obtained between normal control and diabetic groups. b) Plasma AOPPs level measured as free radical mediated protein oxidation during rat aging. Concentration of AOPP is expressed as mmol/L of chloramine-T equivalents. Significant (P < 0.05) difference was obtained normal and control group (one way ANOVA post hoc Bonferroni test). c) Protein carbonyl (PCO) content in plasma of normal and experimental rats groups. PCO level in STZ-induced diabetic rats significantly (#P < 0.05) increased compared to control rats. Oral supplementation of YLE and MLE 200 mg/kg body weight for 28 days treatment significantly (*P < 0.05) decreased the PCO level in plasma compared to diabetic control rats. PCO content is expressed in nmol/mg protein. Values are expressed as mean ± SD for 6 rats in each group.
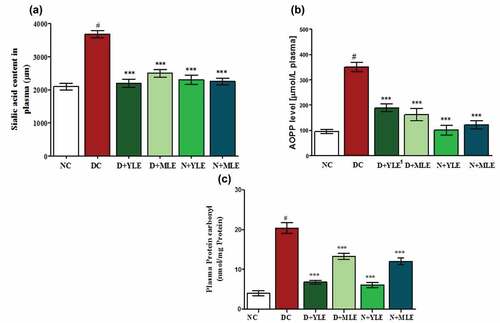
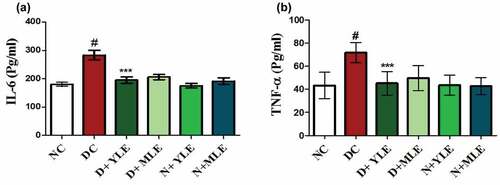
Figure 5. a,b) Inflammatory cytokine level (IL-6 and TNF-alpha) of normal and experimental rats groups. Cytokine level in STZ-induced diabetic rats significantly (#P < 0.05) increased compared to control rats. Oral supplementation of YLE and MLE 200 mg/kg body weight for 28 days of treatment significantly (*P < 0.05) decreased the cytokine level in compared to diabetic control rats. Cytokine content is expressed in pg/ml. Values are expressed as mean ± SD for 6 rats in each group.
Data availability statement
Data available from request to the corresponding author.