Figures & data
Figure 1. Diagram of the experimental design. After a week of acclimatization, male albino rats weighing 120–150 g were fed a high-fat diet (HFD) with or without HCQ (40 mg/kg of body weight [BW]/day orally) for 16 weeks. All rats were analyzed after 18 weeks. Then, the blood and liver tissue were collected for biochemical evaluation.
![Figure 1. Diagram of the experimental design. After a week of acclimatization, male albino rats weighing 120–150 g were fed a high-fat diet (HFD) with or without HCQ (40 mg/kg of body weight [BW]/day orally) for 16 weeks. All rats were analyzed after 18 weeks. Then, the blood and liver tissue were collected for biochemical evaluation.](/cms/asset/78ce506c-9e29-43d9-a820-e38ad5edbb41/teba_a_2211832_f0001_oc.jpg)
Figure 2. Effect of HCQ on body weight changes (a), and weekly glucose levels (b) of the studied groups. Cont.: control, HCQ: hydroxychloroquine, HFD: high-fat diet. ** and *** indicate statistical significance at P < 0.01 and P < 0.001, respectively, compared with the control group. ## and ### indicate statistical significance at P < 0.01 and P < 0.001, respectively, compared with the HCQ group. $$$ indicates statistical significance at P < 0.001 compared with the HFD group.
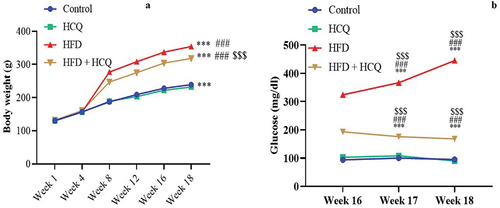
Table 1. Effect of HCQ on glucose levels, glycosylated hemoglobin, and insulin sensitivity in HFD-fed rats.
Figure 3. Effect of HCQ on the levels of cholesterol (a), triglyceride (b), low-density lipoprotein (LDL-C) (c), very low-density lipoprotein (VLDL-C) (d), high-density lipoprotein (HDL-C) (e), and D-dimer (f) in serum of rats in different groups. Cont.: control, HCQ: hydroxychloroquine, HFD: high-fat diet. Values are expressed as means ± SEM (n = 5). (*, **, and *** indicate statistical significance at P < 0.05, P < 0.01, and P < 0.001, respectively, compared with the control group. # and ### indicate statistical significance at P < 0.05 and P < 0.001, respectively, compared with the HCQ group. $$$ indicates statistical significance at P < 0.001 compared with the HFD group).
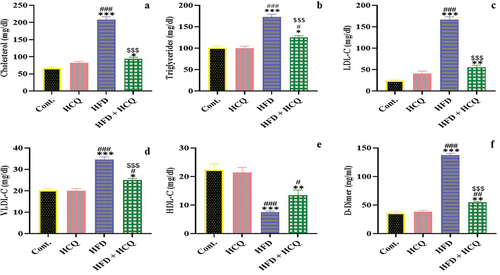
Figure 4. Effect of HCQ on the serum level of troponin-T (a), as well as the activities of creatine kinase myocardial band (CK-MB) (b) and lactate dehydrogenase (LDH) (c) in different groups. Cont.: control, HCQ: hydroxychloroquine, HFD: high-fat diet. Values are expressed as means ± SEM (n = 5). (*, **, and *** indicate statistical significance at P < 0.05, P < 0.01, and P < 0.001, respectively, compared with the control group. # and ### indicate statistical significance at P < 0.05 and P < 0.001, respectively, compared with the HCQ group. $$$ indicates statistical significance at P < 0.001 compared with the HFD group).
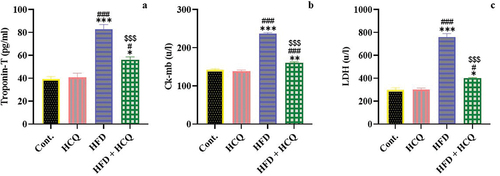
Figure 5. Effect of HCQ on the oxidative stress marker 4-hydroxynonenal (4-HNE) (a), glutathione (GSH) content (b), and glutathione peroxidase (GPx) activity (c) in the liver of rats in different groups. Cont.: control, HCQ: hydroxychloroquine, HFD: high-fat diet. Values are expressed as means ± SEM (n = 5). (** and *** indicate statistical significance at P < 0.01 and P < 0.001, respectively, compared with the control group. ## and ### indicate statistical significance at P < 0.01 and P < 0.001, respectively, compared with the HCQ group. $$$ indicates statistical significance at P < 0.001 compared with the HFD group).
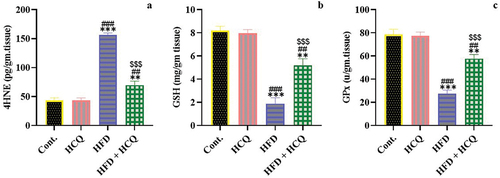
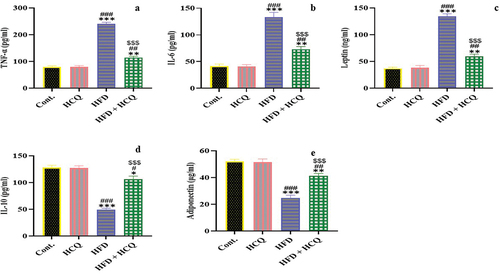
Figure 6. Effect of HCQ on the serum level of tumor necrosis factor alpha (TNF-α) (a), interleukin-6 (IL-6) (b), and leptin (c); interleukin-10 (IL-10) (d) and adiponectin (e) of rats in different groups. Cont.: control, HCQ: hydroxychloroquine, HFD: high-fat diet. Values are expressed as means ± SEM (n = 5). (*, **, and *** indicate statistical significance at P < 0.05, P < 0.01, and P < 0.001, respectively, compared with the control group. #, ##, and ### indicate statistical significance at P < 0.05, P < 0.01, and P < 0.001, respectively, compared with the HCQ group. $$$ indicates statistical significance at P < 0.001 compared with the HFD group).