Figures & data
Table 1. Primer sequences and their product size.
Figure 1. Identification of isolates as S. aureus, A) Microscopic examination of Gram-stained film of S. aureus (100x magnification by oil immersion lens), B) Growth of S. aureus on Blood agar plates, C) Coagulase positive S. aureus with negative control and D) Growth of S. aureus on MSA plate.
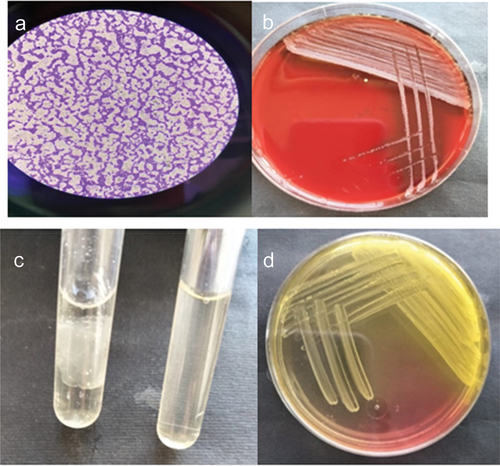
Table 2. Number and percentage of positive isolates for S. aureus collected from different samples during the period of the study.
Table 3. Distribution of S. aureus strains isolated from patients among different Mansoura university hospitals.
Figure 2. Cefoxitin disc diffusion test of MRSA strains by Kirby-Bauer disc diffusion method. The zone size showed in this figure was 15mm, (resistant if ≤ 21mm).
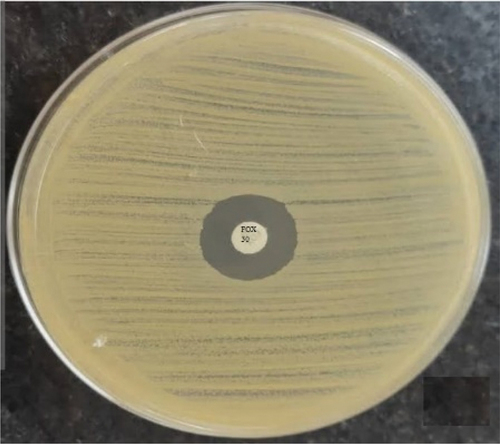
Table 4. Antimicrobial susceptibility test of 50 MRSA isolates.
Table 5. The distribution of CHG MICs among 50 MRSA isolates.
Figure 3. Agarose gel electrophoresis of the Multiplex PCR for the qacA/B1, qacA/B2, smr and norA genes for 24 CHG resistant MRSA strains. M is the ladder DNA.
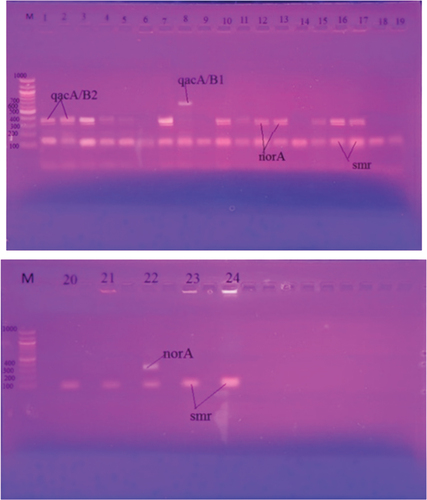
Table 6. Frequency of QACs resistance genes detected by Multiplex PCR among MRSA isolates with MIC ≥4 mg/L (n = 24).
Table 7: Relationship between quaternary ammonium compound (QAC) resistance genes and minimum inhibitory concentrations (MICs) of chlorhexidine (CHG) (n = 24).
Figure 4. Thin-section micrographs of MRSA cells exposed to sub inhibitory concentration of CHG. (A) CHG susceptible MRSA cells after exposure to 1 mg/L CHG; (B) CHG resistant MRSA cells after exposure to 32 mg/L CHG.