Figures & data
Table 1. Primers used in the study for real-time qPCR.
Figure 1. Effect of probiotics and Intermittent fasting on HOMA Ir (A), lipid profile (B) and liver enzymes (C) in different groups. C, control group; HFD, high fat diet group; PR, probiotic group; IF, intermittent fasting group; IP, combined intermittent fasting and probiotics group. Parameters described as mean ±SD, Probability significance <0.05. Test used: One way ANOVA followed by Tukey post hoc test except for Homa IR, Kruskal – Wallis was used. asignificance with control group, bsignificance with HFD group, cSignificance with PR group, dSignificance with if group.
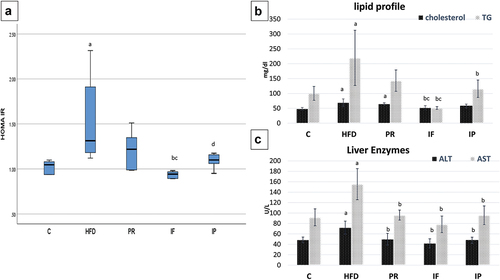
Table 2. Effect of probiotics and intermittent fasting on liver enzymes, lipid profile, insulin resistance in different groups.
Figure 2. Effect of probiotics and intermittent fasting on serum LPS (A), FGF19 (B), FGF 21 (C), FGF21 gene expression (D) and western blotting of FMO3 in liver (E and F) in different groups.C, control group; HFD, high fat diet group; PR, probiotic group; IF, intermittent fasting group; IP, combined intermittent fasting and probiotics group. Parameters described as mean ±SD, Probability significance <0.05. Test used: One way ANOVA followed by Tukey post hoc test. asignificance with control group, bsignificance with HFD group, cSignificance with PR group.
Table 3. Effect of probiotics and intermittent fasting on LPS, FGF19, and FGF21 in serum, FGF21 gene expression in liver tissues, and western blotting of FMO3 in liver tissues.
Figure 3. Microscopic pictures of H&E-stained hepatic sections from C group (A), HFD group (B,C), Pr group (D), if group (E) and IP group (F). Hepatic sections from control group (A) indicates that the hepatic parenchyma, hepatic cords, central veins (CV), portal regions, and sinusoids are normal. Hepatic sections from HFD group (B,C) show diffuse ballooning degeneration in hepatocytes (opened arrowhead), focal macrovesicular steatosis (thin arrows), infiltration of many inflammatory cells (mononuclear cells and eosinophils) in portal areas (thick arrow), and aggregates in sinusoids cells (arrowhead). Hepatic sections from Pr group (D) show diffuse mild hydropic degeneration in hepatocytes (yellow arrows) and localized ballooning degeneration (opened arrowhead). Microscopic images of H&E-stained hepatic slices from the if and IP groups (E and F respectively) show almost normal hepatic parenchyma, normal radially organized hepatic cords, and normal CV. The HFD group shows a significant increase in NAS which is improved markedly by PR, if and IP. IF and IP show more improvement in NAS than PR group. C, control group; HFD, high fat diet group; Pr, probiotic group; IF, intermittent fasting group; IP, combined intermittent fasting and probiotics group; CV, central veins..
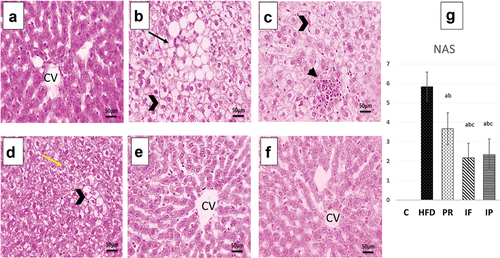
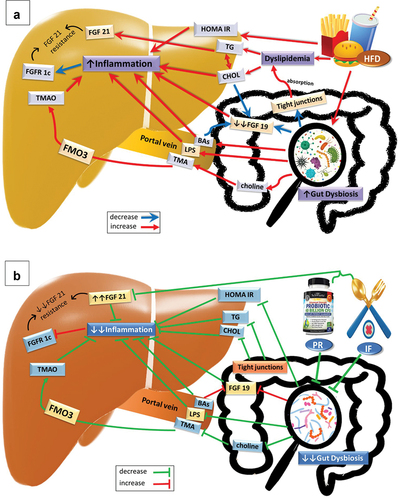
Figure 4. Graphical abstract of the effect of (A) High Fat Diet (HFD), (B) probiotics (PR) and intermittent fasting (IF) on gut microbiota, FGF19, FGF21 and different parameters in the experiment. Abbreviations; BAs: bile acids, CHOL: cholesterol, FGF19: fibroblast growth factor 19, FGF21: fibroblast growth factor 21, FGFR1c: fibroblast growth factor receptor 1c, FMO3: flavin containing dimethylaniline monoxygenase 3, HFD: high fat diet, HOMA IR: homeostasis model assessment-estimated insulin resistance, IF: intermittent fasting, LPS: lipopolysaccharides, PR: probiotics, TG: triglyceride, TMA: trimethylamine and TMAO: trimethylamine N-oxide..