Figures & data
Table 1. Body weight, absolute and relative liver and heart weight changes in the different rat groups.
Figure 1. Effect of vegetable and animal fat consumption on; (i): Serum TC (mg/dl), (ii): Serum TL (mg/dl), (ii): Serum TG (mg/dl). (a) significantly different with corn oil group.
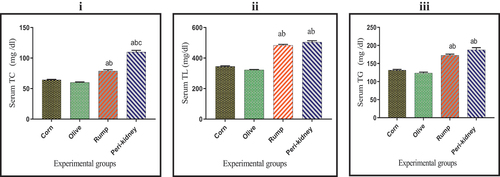
Figure 2. Effect of vegetable and animal fat consumption on; (i): Liver TC (mg/g), (ii): Liver TL (mg/g). (a) significantly different with corn oil group, p < 0.05. (b) significantly different with olive oil group, p < 0.05. (c) significantly different with rump fat group.
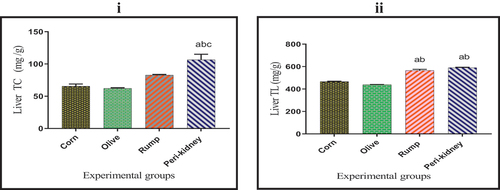
Figure 3. Effect of vegetable and animal fat consumption on; (i): Serum HDLC (mg/dl), (ii): Serum LDLC (mg/dl), (iii): Serum vLDLC (mg/dl), (iv): Atherogenic index (ai).(a) significantly different with corn oil group, p < 0.05. (b) significantly different with olive oil group, p < 0.05. (c) significantly different with rump fat group, p < 0.05. Values are expressed as means ± SEM; (n =6) for each group.
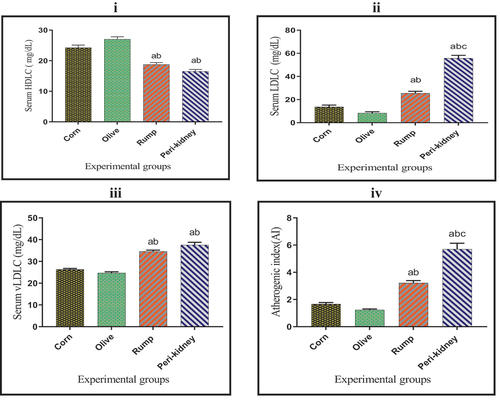
Figure 4. Effect of vegetable and animal fat consumption on; (i): Serum CK MB (pg/ml), (ii): Serum LDH (u/l), (ii): Serum CTn-I (pg/ml). (a) significantly different with corn oil group, p< 0.05. (b) significantly different with olive oil group, p < 0.05. (c) significantly different with rump fat group, p < 0.05. Values are expressed as means± SEM; (n =6) for each group.
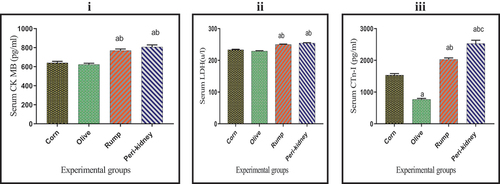
Figure 5. Effect of vegetable and animal fat consumption on; (i): Serum ALT (mg/dl), (ii): Serum AST (mg/dl), (ii): Serum GGT (mg/dl). (iv): Liver ALT (mg/g), (v): Liver AST (mg/g), (vi): Liver GGT (mg/g). (a) significantly different with corn oil group, p< 0.05. (b) significantly different with olive oil group, p < 0.05. (c) significantly different with rump fat group, p < 0.05. Values are expressed as means± SEM; (n =6) for each group.
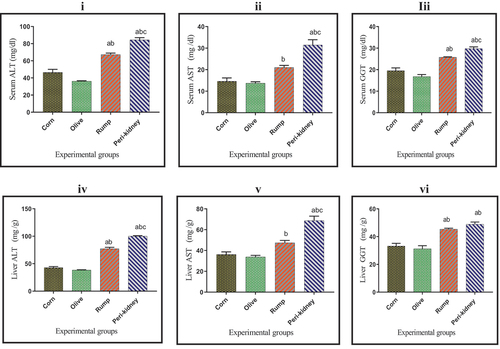
Figure 6. Effect of vegetable and animal fat consumption on; (i): Serum bilirubin (mg/dl) (ii): Serum albumin (mg/dl). (a) significantly different with corn oil group, p< 0.05. (b) significantly different with olive oil group, p < 0.05. (c) significantly different with rump fat group, p < 0.05. Values are expressed as means± SEM; (n =6) for each group.
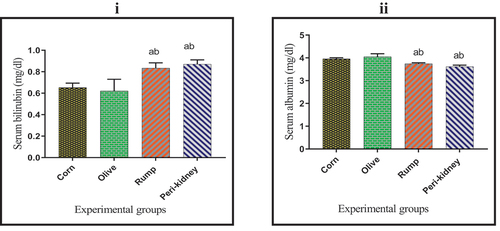
Figure 7. a&b: Photomicrographs of liver section from corn oil fed rats showing hepatic cords (hc), hepatocytes (h), crescent-shaped nucleus (yellow arrow), central vein (cv), monocytes infiltrated (green arrow), blood sinusoids (bs), Kupffer cells (k), bile duct (bd). c&d: liver sections from olive oil fed rats showing hepatic cords (hc), hepatocytes (h), central vein (cv), blood sinusoids (bs), Kupffer cells (k), bile duct (bd). e&f: liver section from rump fat fed rats revealing biliary hyperplasia (bd), macro-vesicular hepatocyte (f), pyknotic nuclei (red arrow), Kupffer cells (k), central vein (cv), blood sinusoids (bs), zonal necrosis (curved arrow), leucocytic infiltration (green arrow), hepatocytes with apoptotic nuclei (red arrow), crescent-shaped nucleus (yellow arrow). g&h: peri-kidney-fat fed rats depicts hepatic cords (hc), dilated central vein (cv), focal hemorrhage here and there in the tissue (blue arrow), inflammatory cells invasion (green arrow), vacuolated hepatocyte (v), pyknotic (red arrow), karyorrhexis (arrowhead). (X100 in right panel, X400 in left panel, X1000 in insets of F&H photomicrographs, H&E).
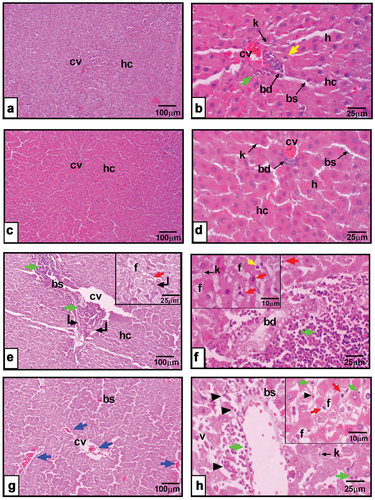
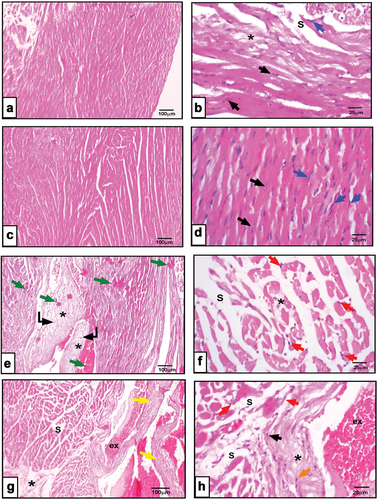
Figure 8. a&b: Photomicrographs of cardiac sections from corn oil fed rats showing slight separation (s), fibrosis of the myofibers (*), cardiomyocytes (black arrow), fibroblasts (blue arrow). c&d: cardiac sections from olive oil fed rats revealing branched myofibers, cardiomyocytes with centrally located oval nuclei (black arrow), fibroblasts lining the interstitial tissue (blue arrow). e&f: heart sections from rump fat fed rats depicting widely separated hyalinized myofibers(s), homogenous highly acidophilic sarcoplasm (green arrow), focal to multifocal necrosis (curved arrow), fibroplasia (*), pyknotic cardiomyocytes (red arrow). g&h: heart sections represent peri-kidney-fat fed rats showing disarrayed separated myofibers (s), pyknotic nuclei (red arrow), dilated congested blood vessels (yellow arrow), thick wall and extravasation (ex), inflammatory infiltration (orange arrows). (X100 in right panel, X400 in left panel, H&E).