
Figures & data
Table 1. Comparison of biochemical markers among studied groups.
Figure 1. (a-d) error bar and box plot charts for mean levels of cholesterol, triglycerides, LDL and HDL in different experimental groups. (a) cholesterol level in the T2DM-induced group demonstrates a significant elevation as compared to the control group, and significantly increase in the T2DM + thyroidectomy compared to the T2DM. It then reduced in the T2DM + thyroidectomy + L thyroxine treated group compared to the T2DM + thyroidectomy group. (b) Triglyceride level is significantly increased in T2DM and T2DM + thyroidectomy groups compared to the control. It then reduced significantly in the T2DM, thyroidectomy and L thyroxine compared to the T2DM + thyroidectomy group. (c) LDL level in the T2DM and the T2DM + thyroidectomy groups illustrate a significant increase compared to the control, and the T2DM + thyroidectomy compared to the T2DM. It then reduced significantly in the T2DM, thyroidectomy and L thyroxine treated group as compared to the T2DM + thyroidectomy group. (d) HDL levels in the T2DM and the T2DM + thyroidectomy groups illustrate a significant decrease compared to the control. It then elevated significantly in the T2DM, thyroidectomy and L thyroxine treated group as compared to the T2DM + thyroidectomy group. Parameters are described as mean ±SD and n = 10.
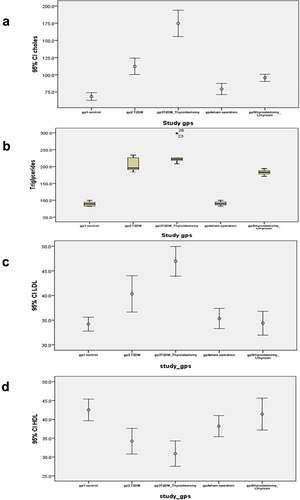
Table 2. Comparison of biochemical renal markers among studied groups.
Figure 2. (a-f) Representative photomicrograph of the kidney from different experimental groups. a) control group shows normal histological appearance of renal parenchyma with normal glomerulus and tubules. Inset demonstrates normal histological appearance of renal tubules. b) T2DM group shows mild glomerular mesangial thickening (thick arrow) with periglomerular aggregation of cellular infiltrates (thin arrow), some tubules appear vacuolated (arrowheads), atrophied necrotic tubules (star). Inset illustrates numerous lymphocytes (thin arrow) surrounding a necrotic tubule with pyknotic nucleus (star). c) T2DM + thyroidectomy group shows multifocal expanded and atrophied glomerulus (thick arrow) with tubular hyalinization, degeneration and necrosis (arrowheads) beside massive interstitial inflammatory aggregates (thin arrow). Inset demonstrates thickened bowman’s capsule (arrowhead) with hyalinized and thickened glomerular capillaries, reduction of uriniferous space and extensive interstitial aggregation of numerous macrophages (thin arrow). d) T2DM + thyroidectomy group demonstrates glomerular mesangial expansion (thick arrow), periglomerular inflammation with interstitial fibrosis (thin arrow) and tubular degeneration (arrowhead). Inset at higher magnification shows periglomerular sclerosis (thin arrow). e) operative sham group shows glomerular expansion (thick arrow) with minimal uriniferous space and interstitial inflammation admixed with few fibroblasts (thin arrow) surrounding a necrotic and ectatic tubules (arrowheads). Inset illustrates mesangial expansion (thickarrow) with periglomerular aggregations of lymphocytes, macrophages and fibroblasts (thin arrow). f) T2DM + thyroidectomy + L-thyroxine group demonstrates restoration of most renal architecture with occasional interstitial inflammation (thin arrow). Inset shows few ectatic tubules (thin arrow). Image magnification = 100×, inset = 400×.
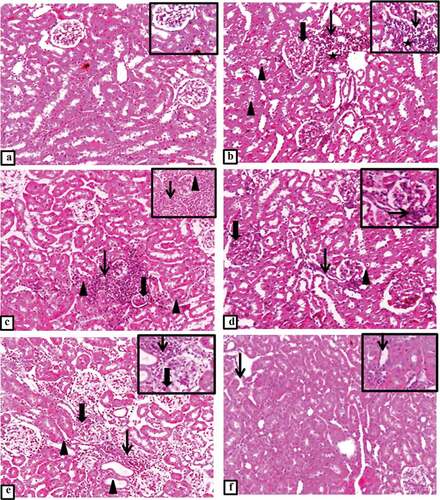
Figure 3. (a-i) Representative photomicrographs of immunostaining expression and localization of TGF-β1 in different treatment groups. a) control group in cortical regions shows positive expression in glomerular (thick arrow), tubulointerstitial cells (thin arrow), and in medullary regions b) illustrates few positivity in medullary interstitial cells (thin arrow). c) T2DM shows intense glomerular expression (thick arrow), tubular expression (arrowhead), marked expression in interstitial medullary aggregations of macrophages (thin arrow) in D. e) T2DM + thyriodectomy illustrates intense TGF-β1 glomerular expression (thin arrow), tubular epithelium (arrowhead), and in f) it reveals increased expression in medullary interstitium (thin arrow) and intense large inflammatory aggregates (thin arrow). g&h) representative cortical and medullary section from the operative sham group demonstrates few expressions in cortical tubulointerstitium (thin arrow), faint cytoplasmic expression in medullary tubular epithelium (arrowhead). I&J) represent cortical and medullary sections from T2DM + thyroidectomy + L-thyroxine, shows no expression in cortical tubules and minimal expression in glomerular mesangial cells (thick arrow) with few positivity in medullary interstitial cells (thin arrow). Image magnification = 400×, scale bar = 50 µm.
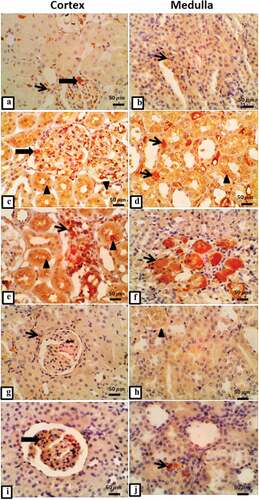
Table 3. Histopathological markers among studied groups.
Figure 4. (a-j) Representative IHC expression of angiotensin II in renal cortical and medullary area of rat in different treated groups. a) control group demonstrates mild tubular Ang II expression (thin arrow), and b) shows mild expression in medullary tubule. c) T2DM group renal cortical regions shows intense positive immuno-stained Ang II in cytoplasm of tubular epithelium (thin arrow), and d) it shows intense Ang II expression in interstitial inflammatory cells (thin arrow), endothelial cells of interstitial capillaries (arrowhead) with moderate expression in intraluminal tubules and cytoplasm of medullary tubules (thick arrow). e) T2DM + thyroidectomy reveals strong tubular expression, and in f) it shows overexpression in medullary interstitium (thin arrow) and intraluminal (thick arrow). g) operative sham group shows moderate expression in medullary tubular and interstitium, and H) shows moderate cytoplasmic expression in cortical tubular epithelial cells (thin arrow). i) T2DM + thyroidectomy + L thyroxine demonstrates moderate cytoplasmic angiotensin expression, and J) shows moderate expression in medullary tubular and interstitium. Image magnification = 400×, scale bar = 50 µm.
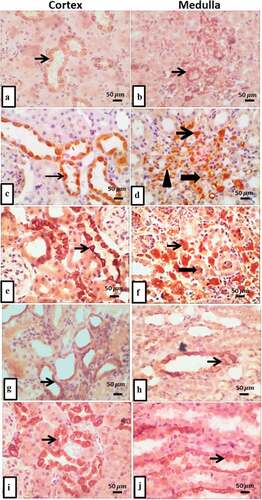
Figure 5. (a-j) Micrographs represent IHC expression of ET-1 in renal cortical and medullary areas in different treated groups. a) control group demonstrates few expressions in cortical tubular epithelium, and b) it reveals faint expression in tubulo-interstitium. c) T2DM shows intense expression of ET-1 in glomerular capillary (thin blue arrow), increased expression in mesangial cells (blue arrowhead), interstitial macrophages and lymphocytes (arrow heads), and in d) it shows intense expression of ET-1 in cytoplasm and lumen of medullary tubules with mild expression in interstitial cells and capillaries. e) T2DM + thyroidectomy demonstrates strong glomerular mesangial and epithelial cells expression of ET-1 (thin arrow), and in f) it shows overexpression of medullary tubulo-interstitium. g) operative sham group shows moderate expression in tubular epithelial cells, and H) shows moderate expression in medullary tubulointerstitium. i) T2DM + thyroidectomy + L-thyroxine shows moderate intraluminal expression of ET-1., and J) shows moderate expression in medullary interstitium. Image magnification = 400×, scale bar = 50 µm.
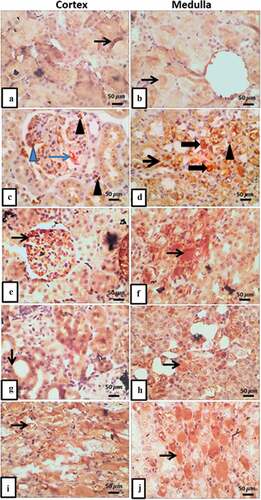
Table 4. Correlation between biochemical markers and histopathological markers among studied groups.