
Figures & data
Table 1. Grid coordinate for specific docking.
Figure 1. Drug-likeness and toxicity screening. a) drug-likeness screening using Lipinski, Veber, and Egan rules. b) toxicity examination based on LD50 and the probability of inducing toxicity.
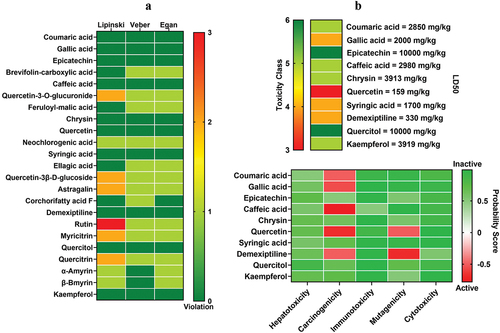
Figure 2. Screening of membrane permeability and bioactivity. a) simulation of the chrysin, epicatechin, Kaempferol, quercitol, and syringic acid penetrating the lipid bilayer. b) the energy transfer value of the six compounds penetrating the phospholipid membrane. c) bioactivity screening. d) the 2D structure of the Kaempferol.
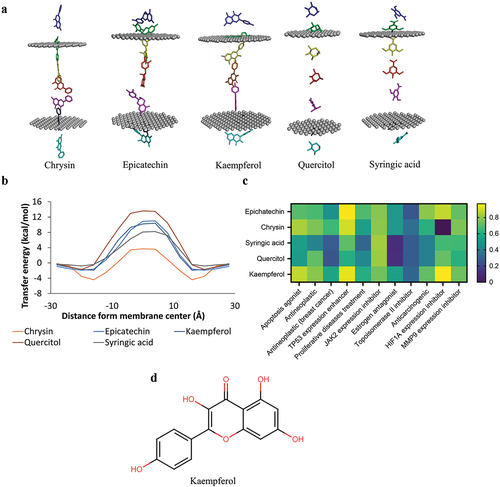
Figure 3. Prediction of protein targets and functional annotation. a) prediction of the direct target of the Kaempferol in the nine protein targets. b) analysis of target proteins with cBioportal found AKT1 and ERα proteins to be involved in breast cancer progression. c) proteins interacting with AKT1 and ERα proteins. d) functional annotation of target proteins.
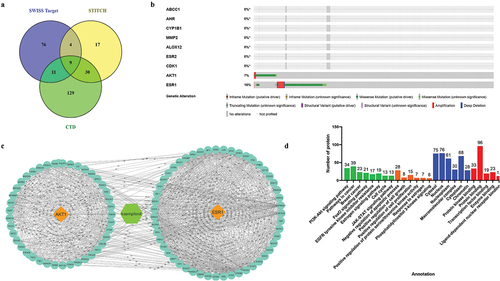
Figure 4. 3D and 2D visualization of protein-ligand interactions. a) interaction between AKT1-inhibitor and AKT1-Kaempferol. b) interaction between ERα-inhibitor and ERα-Kaempferol.
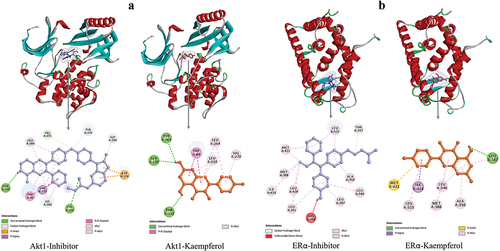
Table 2. Chemical interaction between Akt1 and ERα with the ligands.
Figure 5. Simulation of the molecular dynamics of the interaction between AKT1 and the ligand. a) RMSD backbone proteins. b) RMSD ligand movement. c) number of hydrogen bonds of the AKT1 protein. d) MM/PBSA binding energy values of the AKT1-inhibitor and AKT1-Kaempferol complexes. e) RMSF values of AKT1-inhibitor and AKT1-Kaempferol complexes.
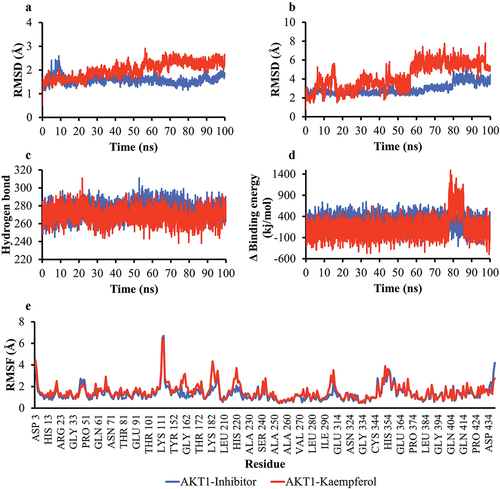
Table 3. Calculations on the binding free energy of the complexes.
Figure 6. Simulation of the molecular dynamics of the interaction between ERα and ligands. a) RMSD backbone proteins. b) RMSD ligand movement. c) number of hydrogen bonds of the Akt1 protein. d) MM/PBSA binding energy value of ERα-inhibitor and ERα-Kaempferol complexes. e) RMSF values of ERα-inhibitor and ERα-Kaempferol complexes.
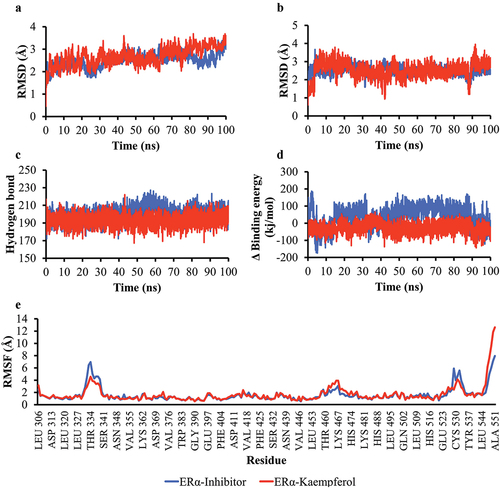
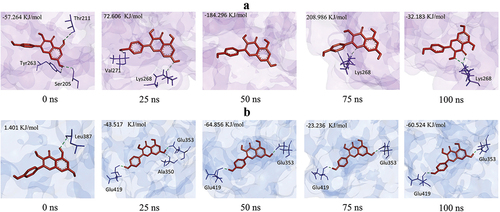
Figure 7. Changes in the pose of Kaempferol during the simulation change the number and position of hydrogen bonds. a) AKT1-Kaempferol, b) ERα-Kaempferol.
Data availability statement
The data supporting the findings of this study, including figures, tables, and raw data, are in the figshare repository and can be accessed using the link: https://doi.org/10.6084/m9.figshare.23742036.