Figures & data
Figure 1. Photomicrographs of colorectal sections post-4 weeks through the mucosal layer showing the epithelium of (a) control and (b) EDTA groups rich with goblet cells (asterisks), (c) DMSO and (d) Nic groups with the normal structure of the mucosa within a few inflammatory cells (arrowheads), (e) DMH group with aberrant crypt foci (ACF) (dashed arrows) and goblet cell reduction (stars), and (f) Nic-DMH group with scattered inflammatory cells (arrowheads) (H&E stain, scale bar: 50 µm).
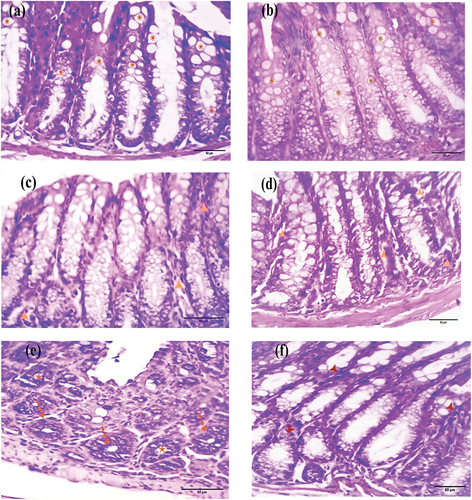
Figure 2. Photomicrograph of colorectal sections post-6 weeks through the mucosa layer showing the epithelium of (a) EDTA, (b) DMSO, and (c) Nic groups with scattered inflammatory cells (arrowheads), (d) DMH group with hyperchromasia (H), dysplastic cells (arrows), and goblet cell reduction (stars), and (e) Nic-DMH group with rich goblet cells (asterisks). (H&E stain, scale bar: 50 µm).
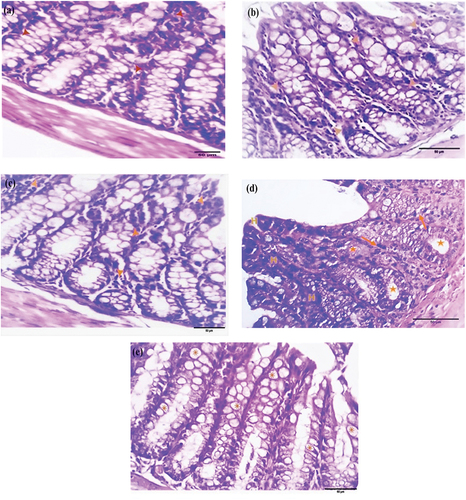
Figure 3. Photomicrograph of colorectal section post-4 weeks through mucosa layer showing (a) control group with mild collagen deposition, (b) EDTA, (c) DMSO, (d) Nic, (e) DMH, and (f) Nic-DMH groups with moderate collagen deposition. (Masson’s trichrome staining, scale bar: 50 µm).
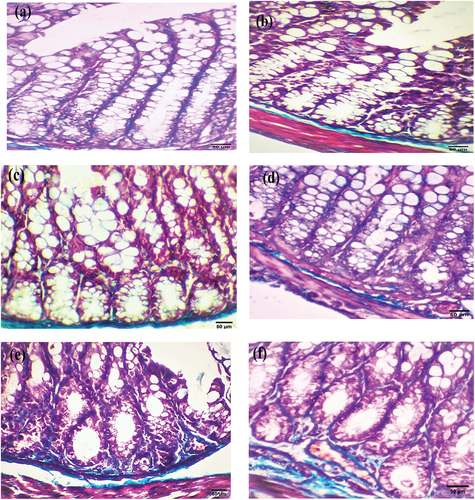
Figure 4. Photomicrograph of colorectal section post-6 weeks through mucosa layer showing (a) EDTA group, (b) DMSO group, and (c) Nic group with moderate collagen deposition, (d) DMH group with strong collagen deposition, and (e) Nic-DMH group with mild collagen deposition (Masson’s trichrome staining, scale bar: 50 µm).
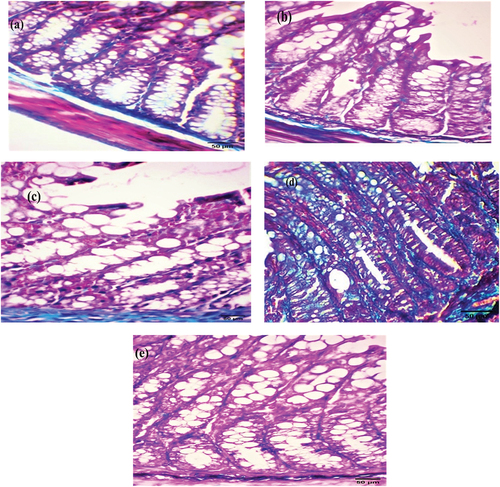
Figure 5. Photomicrograph of the colorectal section after four weeks through the mucosa layer showing (a) control and (b) EDTA groups with negative staining, (c) DMSO, and (d) Nic groups with cytoplasmic immunostaining reactions, (e) DMH group with strong immunostaining reaction, and (f) Nic-DMH group with moderate reaction. (AIF IHC staining; scale bar = 50 µm).
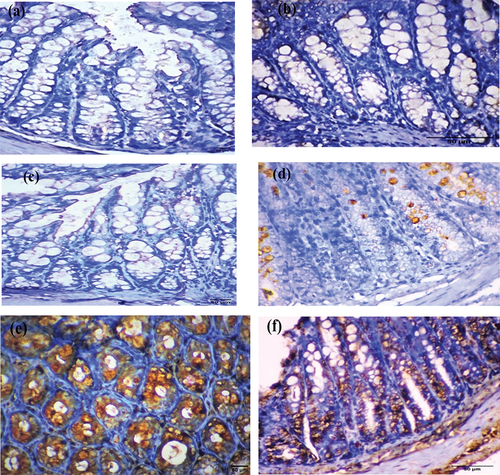
Figure 6. Photomicrograph of colorectal sections post-6 weeks showing AIF immunohistochemical staining through the mucosal layer, with (a) negative staining in the EDTA group, (b) moderate staining in the DMSO group, (c) moderate staining in the Nic group, (d) strong staining in the DMH group, and (e) mild staining in the Nic-DMH group. Scale bar: 50 µm.
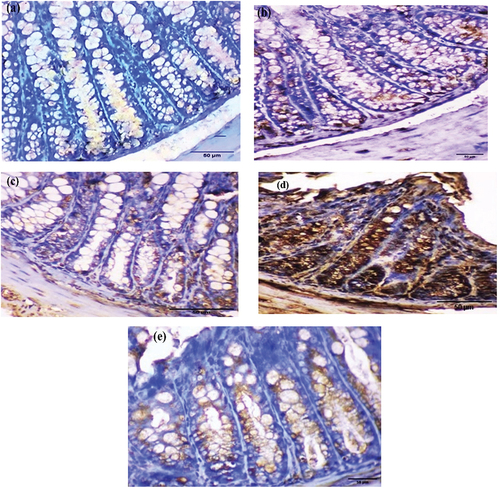
Figure 7. Comparison between the different groups according to AIF.
Figure 8. Comparison between different groups according to MDA content.
Figure 9. Comparison between different study groups according to 8-OHdG concentration.