Figures & data
Table 1. Criteria used in the evaluation of spermatogenesis.
Table 2. Effect of quinestrol on body weights of male and female Nile rats.
Table 3. Effect of quinestrol on sperm characteristics in the Nile grass rats.
Figure 1. Photographs showing the morphological structure of the testis of male Nile grass rats. (a): normal testis with prominent blood vessels over their surface (blue arrows) and large vesicular seminalis (green arrows) (b) the testis of quinestrol-treated males had marked edema (blue arrows) and appeared smaller in size and length. The vesicular seminals were also too small to appear.
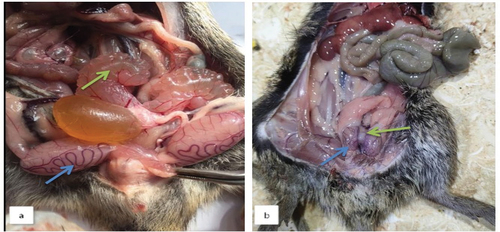
Table 4. Effect of quinestrol on male reproductive organs of male Nile grass rats.
Table 5. Effect of quinestrol on testicular morphometrics analysis and the stage of spermatogenesis in the Nile grass rats.
Table 6. Effect of quinestrol treatment on epididymal ducts and epithelium in the Nile grass rats.
Figure 2. Photomicrographs of testicular sections from normal and treated Nile rat males stained with H&E. Normal males: (a) display a typical testicular structure with seminiferous tubules (ST) and a thin tunica albuginea (arrow); (b) shows regular seminiferous tubules (ST) with narrow intertubular spaces (IT); (c) is a magnified photo of seminiferous tubule with large spermatogenic cells (arrow), lumen filled with abundant spermatozoa (*), and narrow intertubular spaces (IT). Quinestrol-treated males: (d) exhibits deformed seminiferous tubules (ST) and a thickened fibrous tunica albuginea (arrow); (e) shows seminiferous tubules (ST) with marked tubular vacuolar degeneration, necrosis of the germinal epithelium lining the tubules and widening of the intertubular spaces (IT); (f) illustrates marked vascular congestion (vc), seminiferous tubules (ST) with many darkly stained shrunken germinal cells (arrows), and a lumen devoid of spermatozoa (*).
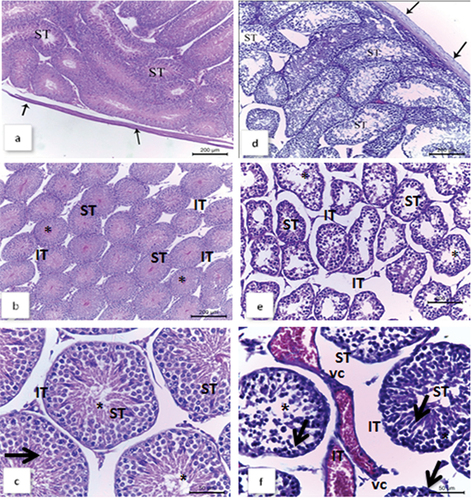
Figure 3. Photomicrographs of epididymal sections from normal males and quinestrol-treated males of Nile rats stained with H&E. Normal males: (a) and (b) show epididymal tubules (ET) lined by pseudostratified columnar epithelium (PE) and filled with spermatozoa (SM) in their lumina. There are narrow interstitial spaces between the ducts (IT). Quinestrol-treated males: (c) and (d) show shrunken epididymal ducts (ET) lined by pseudostratified columnar epithelium (PE). There are wide interstitial spaces between the ducts (IT), that are filled with cellular debris (star), a few spermatozoa are present (red arrow), along with vacuolated epithelial cells (thick arrow), some pyknotic nuclei (thin arrow), and vascular congestion (V).
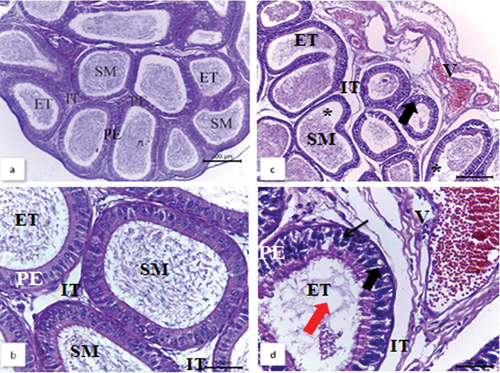
Figure 4. Photomicrographs of testicular sections from male Nile rats, displaying representative immunohistochemical assays for the AR antibody and the immunolocalization of the nuclear androgen receptor (AR) antibody. Normal males: (a) and (b) exhibit strong immunohistochemical staining for AR. In (b), a magnified photo reveals that AR is primarily localized at the basement membrane (thin arrow), germinal cells (thick arrow), and intertubular space (IT). Quinestrol-treated males: (c) and (d) exhibit a weak AR immunoreaction. In (d), a magnified photo shows a higher number of necrotic degenerated seminiferous tubules with weak reaction in destructed germinal cells (thick arrow), basement membrane (thin arrow), and no nearby reaction in intertubular spaces (IT).
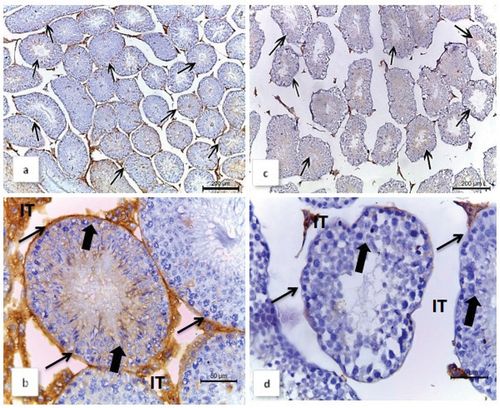
Figure 5. Photomicrographs of testicular sections from male Nile rats illustrating representative immunohistochemical assays for the Wt-1 antibody and immunolocalization of nuclear Wt-1 antibody. In normal males: (a) and (b) exhibit strong brown immunohistochemical stains for Wt-1. A magnified photo in (b) reveals that Wt-1 is primarily localized at the basement membrane (thin arrow), germinal cells (thick arrow), and intertubular space (IT). In quinestrol-treated males, (c) and (d) display a weaker Wt-1 immunoreaction. A magnified view in (d) shows necrotic degenerated seminiferous tubules, with a weak reaction in the destroyed germinal cells (thick arrow) and basement membrane (thin arrow), and nearby no reaction in intertubular spaces (IT).
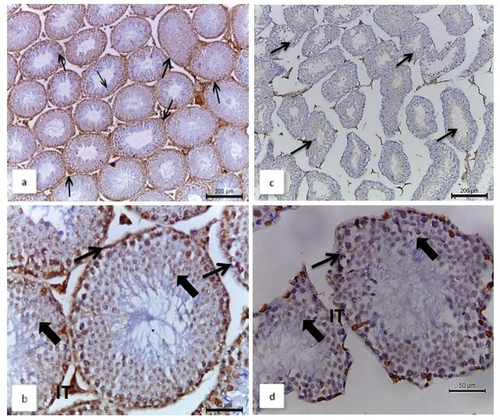
Figure 6. Changes in the mean count of positive cells of immunostaining in the testis of Nile rats in the studied groups. a) Mean count of AR-positive cells. b) Mean count of WT-1 positive cells. Means and SEM are used to express values. P*- value indicated that the values were significantly different from those of the control group, where P*<0.005, and P**<0.001.
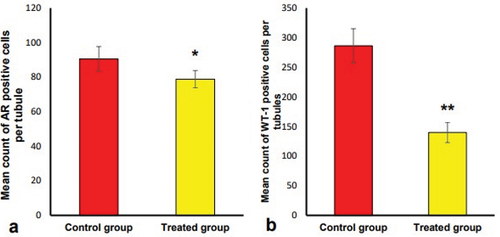
Figure 7. Photomicrographs of epididymal sections of normal and quinestrol-treated males of Nile rats showing immunohistochemical assays with immunolocalization of nuclear androgen receptor (AR) antibody. Normal males: (a) and (b) show an exclusively strong nuclear AR immunoreaction in the epididymal ducts. (b) a magnified photo showed that AR mainly localized at the basement membrane (thin arrow), germinal cells (thick arrow), and intertubular space (IT). Quinestrol-treated males: (c) and (d) show a weak AR immunoreaction (arrows). (d) showed a magnified photo of the number of tubules with weak reactions in destructed germinal cells (thick arrow), basement membrane (thin arrow), and nearby no reaction in intertubular spaces (IT).
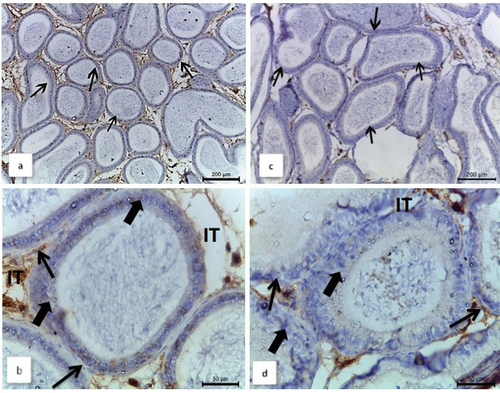
Figure 8. Photomicrographs of epididymal sections of normal and quinestrol-treated males of Nile rats showing immunohistochemical assays with immunolocalization of nuclear (Wt-1) antibody. Normal males: (a) and (b) show an exclusively strong nuclear Wt-1 immunoreaction in the epididymal ducts. (b) a magnified photo showed that Wt-1 mainly localized at the basement membrane (thin arrow), germinal cells (thick arrow), and intertubular space (IT). Quinestrol-treated males: (c) and (d) show a weak Wt-1 immunoreaction (arrows). (d) showed a magnified photo of the number of tubules with weak reaction in destructed germinal cells (thick arrow), basement membrane (thin arrow), and nearby no reaction in intertubular spaces (IT).
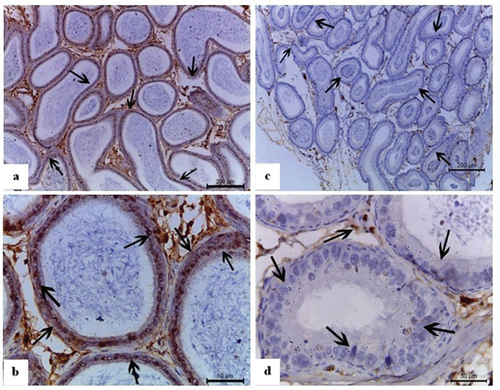
Figure 9. Changes in the mean count of positive cells of immunostaining in the epididymis of Nile rats in the studied groups. a) Mean count of AR-positive cells. b) Mean count of WT-1 positive cells. Means and SEM are used to express values. P* value indicated that the values were significantly different from those of the control group, where P*<0.001.
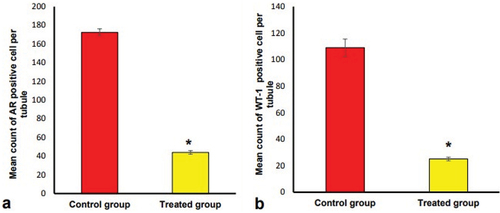
Figure 10. Photographs showing the morphological structure of uteri of female Nile grass rats. (a): normal uterus with high blood supply (arrows), (b) uterus of quinestrol-treated females with marked edema (arrows), (c) uterus of quinestrol-treated females with remarkable erythema (arrows).
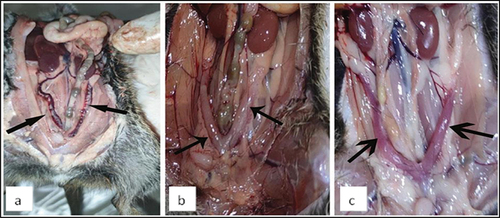
Table 7. Effect of quinestrol on reproductive organs of female Nile grass rats.
Figure 11. Photomicrographs of ovarian sections of female Nile rats stained by H&E. Normal females: (a, b, and c) show ovary with the germinal epithelium (ge) and underline tunica albuginea (Ta), antral follicle (af), Graffian follicle (GF) with primary oocyte (O), zona pellucida (ZP), corona radiate (Cr), follicular antrum (fa), atretic follicle (Atf), and theca folliculi (Tf) between follicles in the ovarian cortex. Quinestrol-treated females: (d, e, and f) show follicular degenerations (fd), corpus luteum (CL), antral follicle (Af), a cleared blood congestion (arrows), a patchy mononuclear infiltration (I) hemorrhagic area (he), nuclear pyknosis and cytoplasmic degeneration (thick arrow) and shrunk oocyte (thin arrow), decrease or shrinkage of zonagranulosa (ZG) and increase of follicular antrum area.
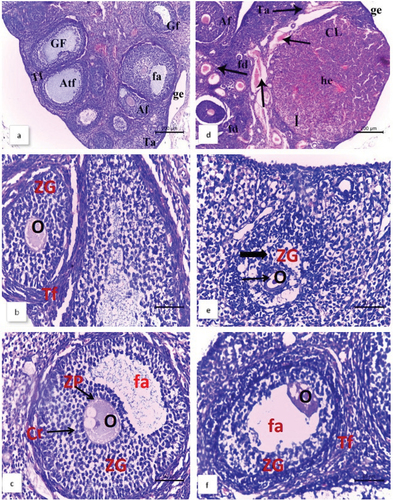
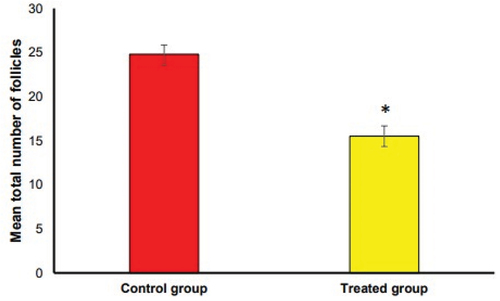
Figure 12. Changes in the mean total number of follicles in the ovaries of Nile rats in the studied groups. Means and SEM are used to express values. P* value indicates that the values were significantly different from those of the control group, where P*< 0.01.