Figures & data
Figure 1. Mean body weight (g) of different experimental groups at 1-, 7-, and 21-day-old offspring rats of hyperlipidemic mothers treated with HFD (20%) and HFD with either fenugreek or barley treatment (20%). N = 5/group. Letters shown in pair of groups that is significantly different from each other (p ≤ 0.05).
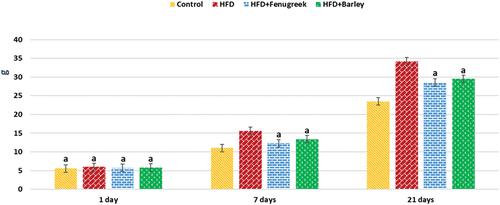
Table 1. Mean body weight (g) of different experimental groups at 1-, 7-, and 21-day-old offspring rats of hyperlipidemic mothers treated with HFD (20%) and HFD with either fenugreek or barley treatment (20%).
Table 2. Identification of microbiota in the intestine of 21-day-old rats treated with HFD with or without fenugreek or barley.
Table 3. Mean count of bacterial strains in intestine of 21-day-old offspring rats of hyperlipidemic mothers treated with HFD (20%) with or without germinating fenugreek or barley grains treatment (20%).
Table 4. Biochemical parameters in serum samples of 21-day-old offspring from hyperlipidemic mothers treated with HFD (20%) with or without germinating barley or fenugreek grains supplementation.
Table 5. Biochemical parameters in tibialis muscle samples of 21-day-old offspring from hyperlipidemic mothers with or without germinating barley or fenugreek grains supplementation.
Figure 2. Photomicrographs of histological tibialis muscle fibers sections stained by hematoxylin and eosin (H&E) in 21-day-old rat. (a & a1) control rats showing regular muscle fibers. (b, b1, c & c1) neonates of hyperlipidemic mother showing increased inflammatory cells, separation between muscle fibers and degenerated muscle fibers.
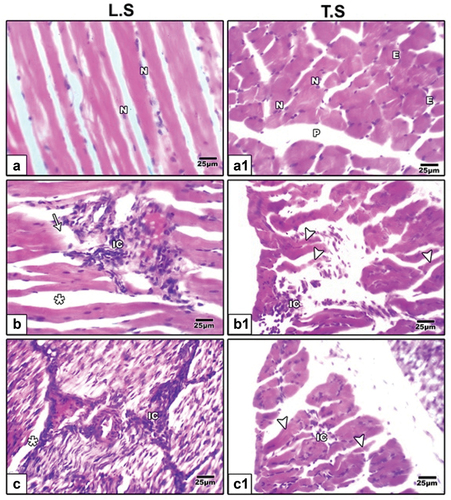
Figure 3. Photomicrographs of histological sections of tibialis muscle stained by hematoxylin and eosin (H&E) in 21-day-old rat. High fat diet plus germinating (d & d1) barley and (e & e1) fenugreek grains supplementation showed improvement in muscle fibers.
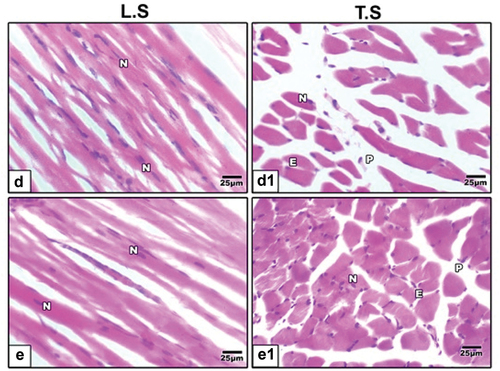
Figure 4. Periodic acid schiff (PAS) staining of tibialis muscle fibers biopsies in 21-day-old rats. a & a1 control showing negative expression. b & b1 neonates of hyperlipidemic mother showing strong expression. c & c1 high fat diet plus germinating barley grains supplementation showing weak expression. d & d1 high fat diet plus germinating fenugreek grains supplementation showing weak expression. Arrow head indicating histochemical reaction of PAS.
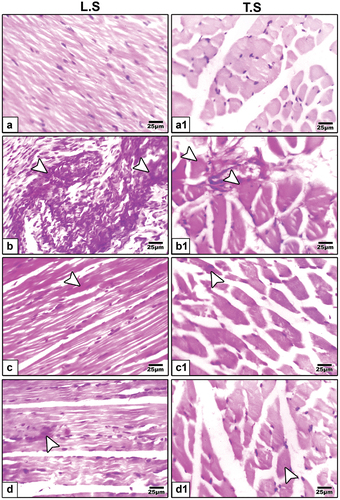
Figure 5. Average perimeter of tibialis muscle fibers in 21-day-old rats treated with HFD, HFD+Barley and HFD+Fenugreek compared to control group. Statistical analysis shows that HFD and HFD+Barley groups are significant (p ≤ 0.05) while HFD+Fenugreek group is non-significant compared to control group.
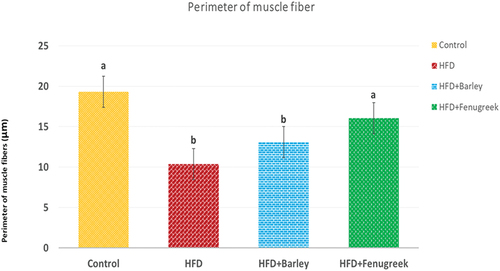
Figure 6. Photomicrographs of formalin fixed histological sections of tibialis muscle fibers immunohistochemical stained with desmin of 21-day-old rat. (a) Control showing weak reaction of desmin. (b) High fat diet showing increased dark brown reaction of desmin in muscle fibers indicating cell death. High fat diet treated with (c) barley and (d) fenugreek supplementation showing decreased immunohistochemical reaction of desmin. Arrow head indicating desmin immunohistochemical reaction.
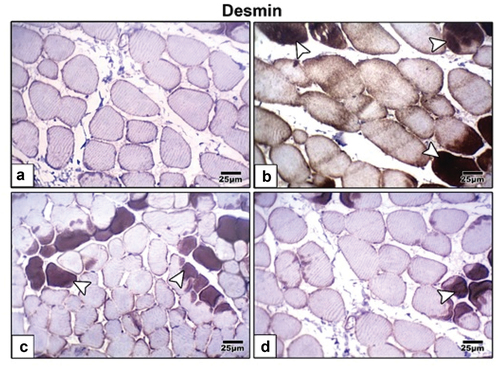
Figure 7. Histogram illustrating the percentages of immunohistochemical reaction of desmin in tibialis muscle of 21-day-old rats fed on diet rich in fat with or without fenugreek or barley grains supplementation. Note over expression of desmin in tibialis muscle of 21-day-old rats fed on diet rich in fat and improved in that received either fenugreek or barley grains plus a high fat diet. Statistical analysis showing that HFD+Barley group is significant with control group (p ≤ 0.05) while HFD+Fenugreek group is non-significant with control and HFD+Barley groups and HFD group is significant with all other groups (p ≤ 0.05).
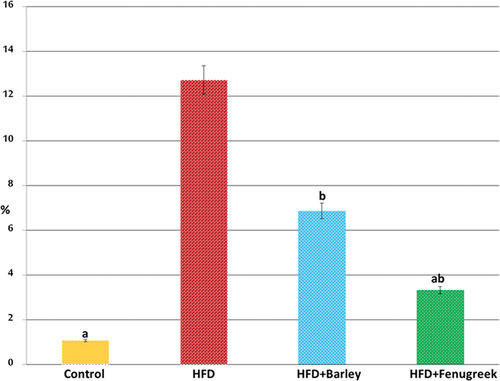
Figure 8. Photomicrographs of formalin fixed histological sections of skeletal muscle fibers immunohistochemical stained with P53 of 21-day-old rat. (a) Control revealed weak immunohistochemical reaction of P53. (b) High fat diet revealed increased dark brown P53 immunohistochemical reaction in muscle fibers manifesting cell death. High fat diet with (c) barley and (d) fenugreek supplementation revealed decreased immunohistochemical reaction of P53. Arrow head indicating immunohistochemical reaction of P53.
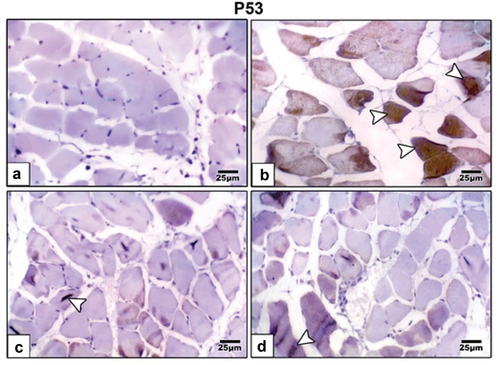
Figure 9. Histogram illustrating the percentages of immunohistochemical reaction of P53 in tibia muscle of 21-day-old rats fed on diet rich in fat with or without fenugreek or barley grains supplementation. Note over expression of P53 in tibia muscle of 21-day-old rats fed on diet rich in fat and improved in that received either fenugreek or barley grains plus a high fat diet. Statistical analysis showing that HFD+Barley and HFD+Fenugreek groups are non-significant with control and HFD group is significant to all other groups(p ≤ 0.05).
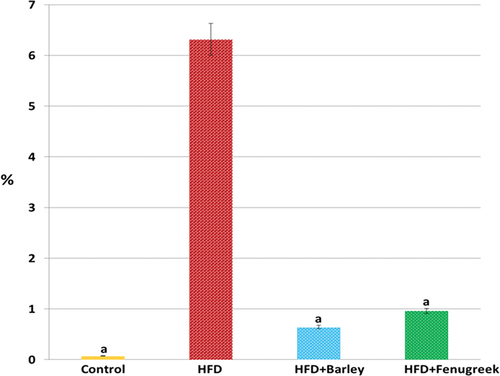
Figure 10. Transmission electron micrographs of skeletal muscle in 21-day-old rat. (a & b) control showed regularly arranged muscle fibers with normal distribution of A-band, I-band, Z-line & H-zone, normal nucleus with peripheral arrangement of heterochromatin, abundant mitochondria in between muscle fibers and glycogen granules. (c, d & e) high fat diet showing degenerated nucleus with clamped chromatin, fat droplets, degenerated muscle fibers, atrophied mitochondria. Abbreviation: A, dark band; G, glycogen granules; H, H-zone; I, light band; M, mitochondria; N, nucleus; Ne, nuclear envelope; Z, Z-line; asterisk*, degenerated muscle fibers; AM, atrophied mitochondria; F, fat droplets; DN, degenerated nucleus.
Figure 11. Transmission electron micrographs of skeletal muscle in 21-day-old rat. High fat diet with (f & g) barley and (h & i) fenugreek grains supplementation showed improvement in muscle fibers and nucleus with peripheral arrangement of heterochromatin and showed abundant mitochondria in between muscle fibers, glycogen granules, blood vessel and red blood cell. Abbreviation: M, mitochondria; N, nucleus; nu, nucleolus; BV, blood vessel; RBC, red blood cell; G, glycogen granules.