Figures & data
Figure 1. The mean % value of food consumption among the control and the IS group of mothers rats (panel a), changes in body weight (g) of both mother’s rats (panel b), and their offspring (panel c), and percentage of abortion (panel d). Note a highly significant decrease (*) in food consumaption and body weight among IS rats comparatively with control.
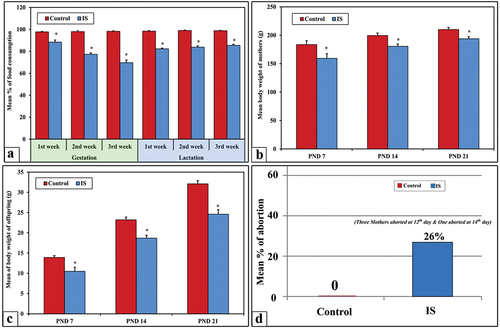
Figure 2. Photograph illustrating the uterine horns and congenital anomalies among the fetuses of control rat (a) and aborted IS (b) at 20th day of gestation. Note that the uterine horns (UH) and fetuses (image a) of control rats with normal anatomical pattern. On the other hand, a pronounced atrophied uterine horn (AUH) with partial fetus resorption (FR) appears in the IS rat (image b). Also, some fetuses from dissected IS rats at 20th day showing different morphological anomalies (images d–g) like microtia (green arrow), kyphosis (blue star), microphthalmia (white arrow) and subcutaneous hemorrhage in abdominal are (yellow star) with obvious hind limb paralysis. Image C representing the normal gross morphological pattern of fetuses taken from control.
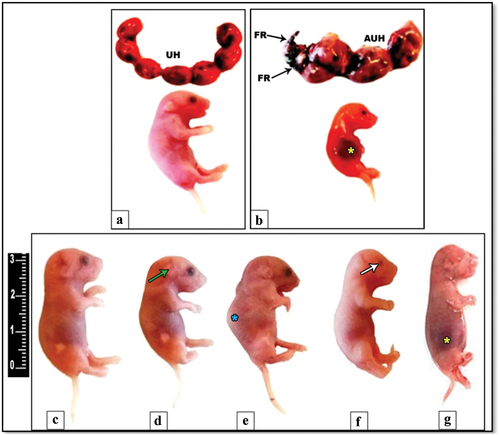
Figure 3. Photograph illustrating the congenital anomalies of bones among the fetuses of IS induced pregnant rats at 20th day of gestation. The skeleton of fetuses from control rats (image a), for IS group, skull occipital bones (image b), upper limbs, thoracic vertebrae, and ribs (image c), and lumber vertebrae and lower limbs (image d). (Alizarin-stained bony skeleton).
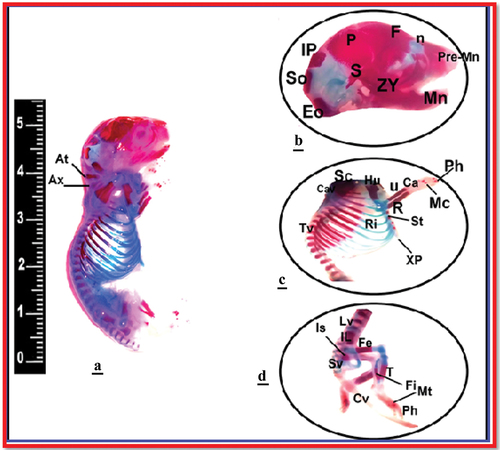
Figure 4. The mean levels of serum serotonin, cortisol, insulin, and blood glucose of mother rats groups.
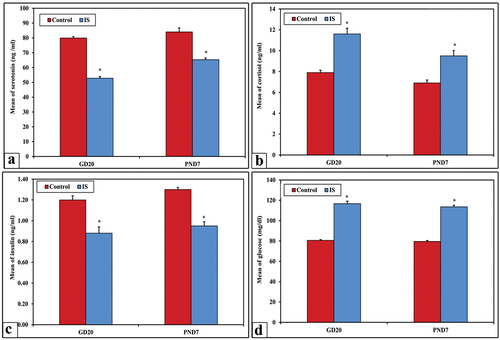
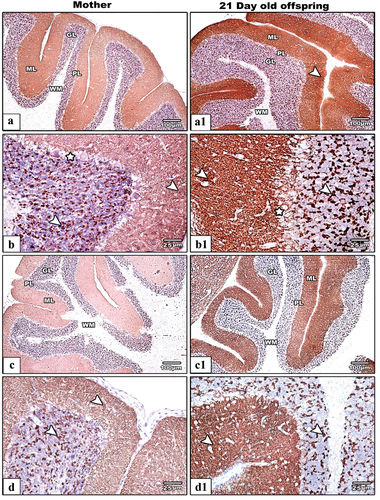
Figure 5. Images from histological sections of cerebral cortex of control and IS mother’s rats (panels a&b) and their offspring at PND21 (b&b1) respectively. The cerebral cortex of IS mothers rats and their offspring display obvious hypertrophied neurons (HN), dilated blood capillaries and infiltrated cells (star). (H&E stain, scale bar: 25µm). Abbreviations: Glial cells (GC), Pyramidal neurons (N) and Interstitial neuropils (NI), Blood capillaries (BC), Hypertrophied neurons (HN), Dilated blood capillaries (DBC), and Infiltrated neurons (asterisk).
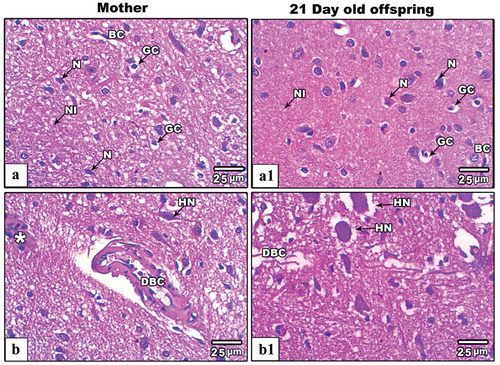
Figure 6. Images from histological sections of cerebellar cortex of control and IS mother’s rats (panels a&b) and their offspring at PND21 (b&b1) respectively. The cerebellar cortex of IS mothers rats and their pups showing fragmented pia matter (white asterisk), vacuolated basket and granular cells (white arrow heads), nonadjacent granular cels (black asterisk). Also, some Purkinje cells appear lysed (yellow asterisk), hypertrophied (green asterisks) and pyknotic (PPC). (H&E stain, scale bar: 25µm).
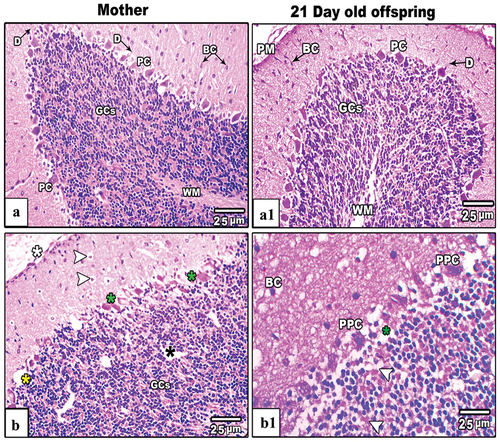
Figure 7. Transmission electron micrograph (TEM) through the basket (panel a&a1), Purkinje (panel b&b1) and granular (panel c&c1) cells of the cerebellar cortex of control (c) and IS mother rats respectively. Cellular images from control cerebellar cortex (a–c) appear with normal nucleus (N) and nucleolus (Nu), mitochodria (M), RER (arrow heads), SER (arrow), lysosomes (L). The cellular images from IS cerebellar cortex (a1–c1) there are pyknotic nuclei (PN), vacuoalted cytoplasm (white asterisks), dilated and de-granulated RER (double arrow heads), dialted Golgi bodies (black asterisk) and atrophied and vacuolated mitochondria (zigzag arrows). (Scale bar is indicated in the lower left handed side for each image).
Figure 8. Transmission electron micrograph (TEM) through the basket (panel a&a1), Purkinje (panel b&b1) and granular (panel c&c1) cells of the cerebellar cortex of control and IS maternally induced rats offspring respectively. The cellular images from IS cerebellar cortex (a1-c1) there are pyknotic nuclei (PN), vacuoalted cytoplasm (white asterisks), dilated and de-granulated RER (double arrow heads), condensed Golgi bodies (black asterisk) and atrophied and vacuolated mitochondria (zigzag arrows). (Scale bar is indicated in the lower left handed side for each image).
Figure 9. Images from histological sections of heart ventricles of control (a&b) and IS mother rats (c&d) (left hand panels) and their offspring at PND21(control:a1&b1and IS:c1&d1)(right hand panels). In control group the pericardium (PC) endocardium (EC) and mocardium (MC) appear intact. In IS female rats and their pups the ventricular sections showing hypertrophied (arrow heads), necrotic myocardial cells (arrows), congested (CBC) and dilated blood capillaries (DBC), and less tight junction among myocardial fibers (star).
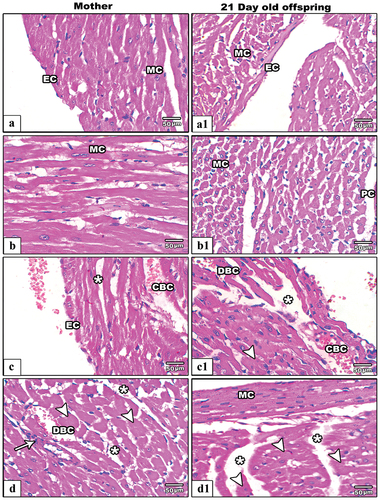
Figure 10. TEM through the myocardial fibers of control and IS mother’s rats (panels a&a1) and their offspring at PND21 (b&b1) respectively. In control mothers’ rats and their offspring, the TEM of myocardial fibers appear with well striated myofibrils which had regular architectures of sarcomeres (distance between two successive Z-lines; red line in images). In IS rats and their pups, the myocardial fibers appear compressed and hypertrophied (*) with lysed (arrowhead) and vacuolated moitochondria (VM) as well as pyknotic nucleus (PN). Abbreviations: MF; myofibrils, M; mitochondria, ID; intercalated disc, N; nucleus, I; isotropic band (light band), A; anisotropic band (dark band), Z; zigzag-line, CT; connective tissue, H; H-zone, PN; pyknotic nucleus and LD; lipid droplet. Sarcomere is indicated by the distance between two successive Z-lines.
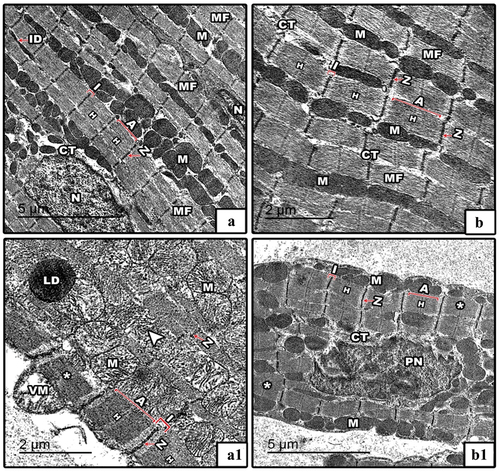
Figure 11. Photomicrograph of SYN antibody-stained embedded paraffin slices of cerebellar cortex from control (Images a&b) and IS (Images c&d) mother rats and their offspring (control: (Images A1&B1 IS: (Images c1&d1). In IS mothers rats and their pups the SYP immunoreactivity appear less expressed comparatively with their control. The arrows heads point to the localization of SYP immune expression.) Synaptophysin antibody satin, images a,a1,c&c1 the scale bar = 100 µm, images b,b1d&d1 the scale bar = 25µm).