Figures & data
Table 1. Primer sequences used for qPCR, F: forward primer; R: reverse primer.
Table 2. Scheuer system for grading and staging chronic hepatitis.
Figure 1. Comparison of brain/body weight ratio among the experimental groups. Values are presented as mean ± SD.
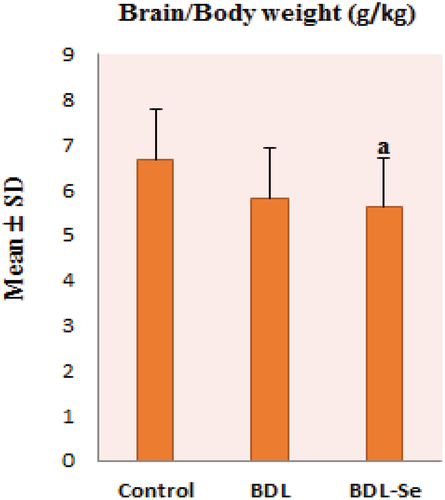
Table 3. Effect of selenium on serum liver enzymes activity among the studied groups.
Figure 2. Comparison of brain glutamine level among the experimental groups. Values are presented as mean ± SD.
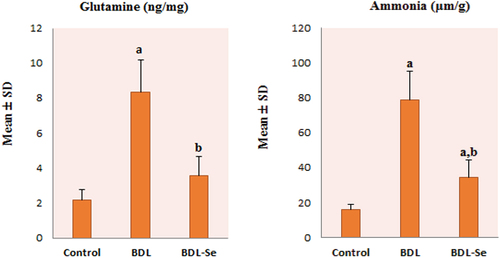
Figure 3. Comparison of brain MDA and GSH content among the experimental groups. Values are presented as mean ± SD.
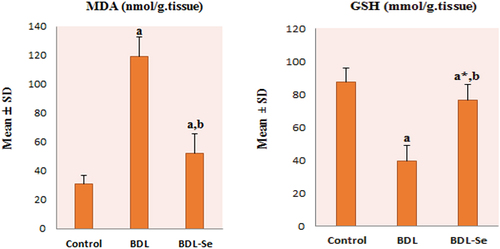
Figure 4. Comparison of brain IL-1β levels and c-fos mRNA relative expression among the experimental groups. Values are presented as mean ± SD.
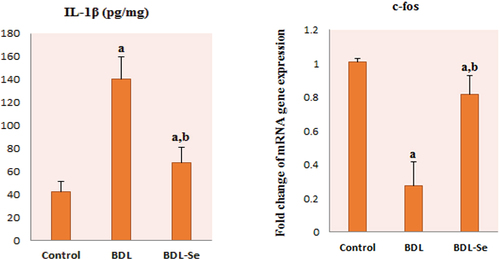
Figure 5. Correlation between brain c-fos expression and brain levels of: (a) MDA, (b) GSH, (c) Ammonia, (d) Glutamine, and (e) IL-1β.
Figure 6. Histopathologic features of liver sections from sham-operated group. (a) Section stained with hematoxylin and eosin shows average central veins (black arrows), average portal tracts (blue arrows), and average hepatocytes (red arrow) (X200). (b) Masson trichrome stained section from the same group shows average collagen distribution around the central vein (black arrows) (X100).
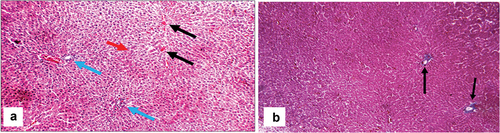
Figure 7. Histopathologic features of liver sections from bile duct-ligated group. (a) Section stained with hematoxylin and eosin (H&E) shows markedly expanded edematous portal tract (blue arrows) with a markedly dilated, congested portal vein (PV), proliferating bile ducts (grey arrows), moderate portal (green arrow), and peri-portal inflammatory infiltrate (yellow arrow) (X200). (b) Another view from the same group shows markedly expanded edematous portal tracts (blue arrows) with markedly dilated PV, irregular hepatic lobule (red arrows), and moderate peri-portal inflammatory infiltrate (green arrows) (H&E, X200). (c) Another view from the same group shows markedly dilated central vein with intra-venous embolus (black arrow) and scattered apoptotic hepatocytes in the peri-venular area (red arrows) (H&E, X 400) (d) Masson trichrome stained section from the same group shows excess collagen (yellow arrows) with nodular formation (black arrows) (X200).
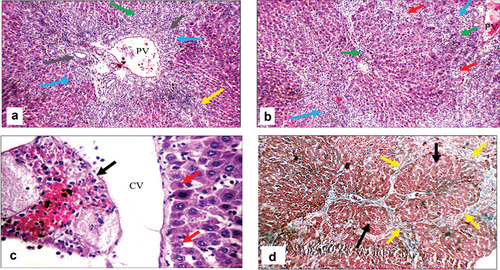
Figure 8. Histopathologic features of liver sections from bile duct ligated-selenium group. (a) Section stained with hematoxylin and eosin (H&E) shows portal tract with dilated portal vein (PV), mild portal inflammatory infiltrate (yellow arrows) and average hepatocytes (red arrow) (X200). (b) Higher magnification of the previous section shows dilated PV, proliferating bile ducts with average epithelial lining (grey arrow), mild portal inflammatory infiltrate (yellow arrow), and scattered apoptotic hepatocytes in the interface area (red arrows) (H&E, X400). (c) Another section shows an expanded portal tract with mild portal inflammatory infiltrate (yellow arrows), and mild fibrosis with architectural distortion (red arrows) (H&E, X200). (d) Masson trichrome stained section from the same group shows mild fibrosis with architectural distortion (black arrows) (X200).
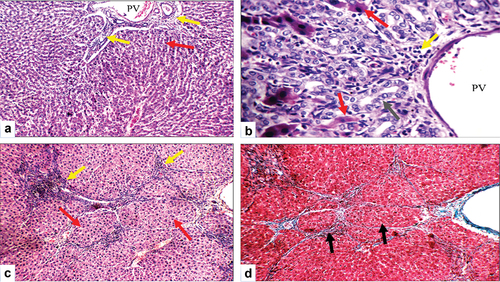
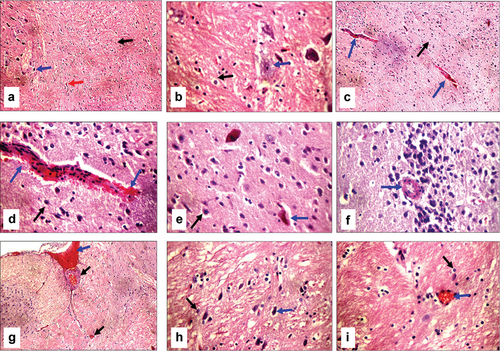
Figure 9. Histopathologic features of brain sections stained with hematoxylin and eosin; (a) Sham operated group shows average astrocytes (black arrow), average neurons (blue arrow), and average blood vessels (red arrow) in fibrillary background (X200). (b) Higher magnification of the previous section shows average astrocytes (black arrow) with average neurons (blue arrow) in a fibrillary background (X400). (c) Bile duct-ligated (BDL) group shows average astrocytes in a fibrillary background (black arrow), and ruptured small blood vessels (blue arrows) (X200). (d) Higher magnification of the previous section shows average astrocytes in a fibrillary background (black arrow), and ruptured small blood vessels with extravasated red cells (blue arrows) (X400). (e) Another view of the BDL group shows average astrocytes in the fibrillary background (black arrow), and scattered degenerated neurons (blue arrow) (X400). (f) Another section of the BDL group shows thick-walled blood vessels in the hippocampus (blue arrow) (X400). (g) Bile duct ligated-selenium (BDL-Se) group shows less dilated congested blood vessels (black arrows) and dilated congested blood sinusoids (blue arrow) (X200). (h) BDL-Se group shows average astrocytes in the fibrillary background (black arrow) and average neurons (blue arrow) (X400). (i) BDL-Se group shows average astrocytes in the fibrillary background (black arrow) and less congested blood vessels (blue arrow) (X400).