
Figures & data
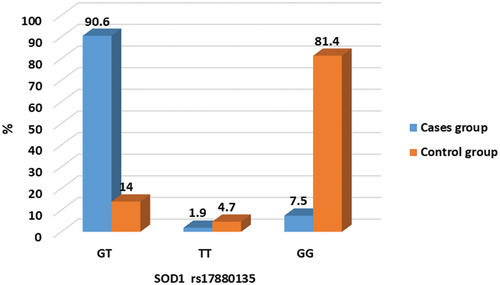
Table 1. primers used in this study for the detection of SNP in SOD1 and SOD2 genes.
Table 2. Comparison of age and gender among the studied groups. χ2: chi-square test.
Table 3. Comparison of biochemical parameters within the studied groups. Z: Mann Whitney U test. Parameters are described as median (min-max) (interquartile range). P is significant when < 0.05. *Statistically significant.
Figure 1. Gel electrophoresis (2%) for PCR product of SOD1 rs1041740. Lane M indicates DNA marker (50 bp). Specific 421 bp band illustrates C or T alleles; Lanes (C1, C2 and C3) represent CC homozygous genotyping, where T allele absents in control group. Lanes (P1, P2, P3, P4 and P5) represent CT heterozygous genotyping; where both C and T alleles were detected at 421 bp in cases group; lane P6 represents TT homozygous genotyping where T allele appears in cases group.
Figure 2. There were no significant differences in SOD1 rs1041740 genotypes between studied groups.
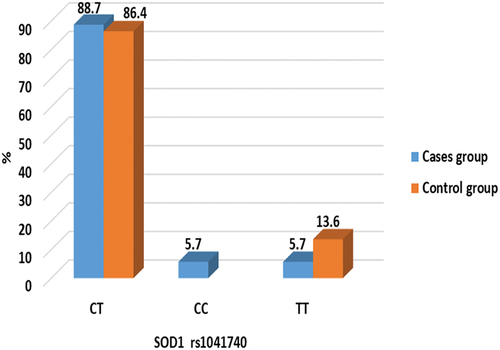
Table 4. Comparison of SOD1 rs1041740 genotypes between the studied groups. Data was expressed as frequency and percentage. χ2: Chi-Square test, Z: Mann Whitney U test, FET: Fisher’s exact test. Parameters are described as numbers (Percentage). P is significant when < 0.05.
Figure 3. Gel electrophoresis (2%) for the PCR product of SOD1 rs17880135; Lane M indicates DNA marker (50 bp). Specific 256 bp bands illustrate G or T alleles; Lanes (C1, C2 and C3) represent GG homozygous genotyping where T allele absents in control group. Lane (P1, P2, P4, P5 and P6) represent GT heterozygous genotyping, where G and T alleles appear at 256 bp in cases group. Lane P3 represents TT homozygous genotyping where T allele appears in cases group.
Figure 4. Significant difference in SOD1 rs17880135 was found between studied groups.

Table 5. Comparison of SOD1 rs17880135 genotypes between the studied groups. χ2: Chi-Square test, Z: Mann Whitney U test. Parameters are described as numbers (Percentage). P is significant when < 0.05. * Statistically significant.
Figure 5. Gel electrophoresis (2%) for PCR product of SOD2 rs4880. Lane M indicates DNA marker (50 bp). Specific 356 bp band illustrates T or C allele. Lanes (C1, C2 and C3) represent TT homozygous genotyping where C allele absents in control group. Lanes (P1, P2) represent CC homozygous genotyping where C allele appears at lanes P1 and P2 at 356 bp in cases group while lanes (P3, P4, P5 and P6) represent TC heterozygous genotyping where T and C alleles appear at 356 bp in cases group.
Figure 6. Significant higher TT allele genotype in SOD2 rs4880 between studied groups.
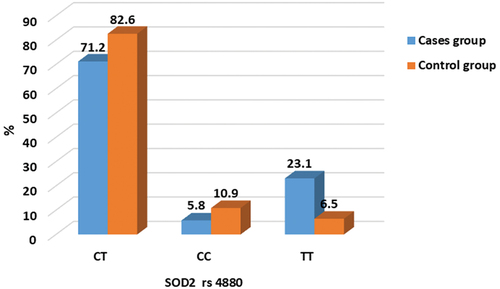
Table 6. Comparison of SOD2 rs4880 genotypes between the studied groups. χ2: Chi-Square test, parameters are described as number (percentage).
Table 7. Relation between SOD1 rs17880135 SNP genotypes and laboratory findings among cases. Z: Mann Whitney U test, *statistically significant. Parameters are described as median (min-max) (interquartile range).
Table 8. Relation between SOD2 rs4880 SNP genotypes and laboratory findings among cases. Z: Mann Whitney U test, *statistically significant. Parameters are described as median (min-max) (interquartile range).