
Figures & data
Figure 1. NCBI reference sequence: NG_007524.2.
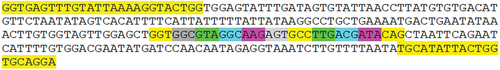
Figure 2. Agarose gel (1.5%) post-electrophoresis displayed 263 bp PCR products in lanes 2, 3, and 4 for KRAS gene mutation linked to (CRC). Lane 1 had a 100 bp DNA ladder.
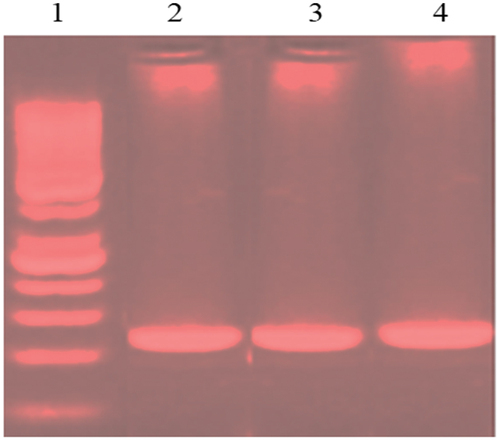
Figure 3. g.10653 codon 12 substitution G>T, ggt> tgt Rs121913530 nucleotide sequence (forward) in KRAS gene, exon 2.
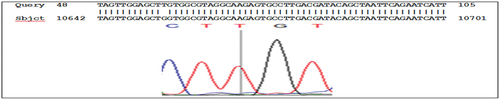
Figure 4. g.10658 codon 13 substitution G>A, rs397517040 ggc>gac nucleotide sequence (forward) in KRAS, exon 2.
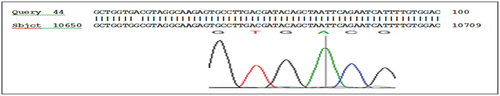
Figure 5. g.10683 codon 22 cag>gag substitution C>G, nucleotide sequence (forward) in KRAS gene, exon 2.
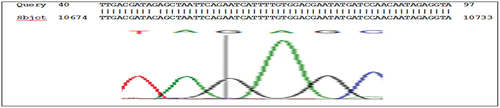
Table 1. Distribution the KRAS gene with (CRC) study in wild-type and mutation according to age, gender and histological-cell.
Table 2. Correlation between age, gender and histological cell with KRAS mutation.
Table 3. Codons 12, 13 and 22 and amino acids change.