
Figures & data
Figure 1. Vehicle-track interaction model (a) Side view; (b) End view; (c) Global coordinate system
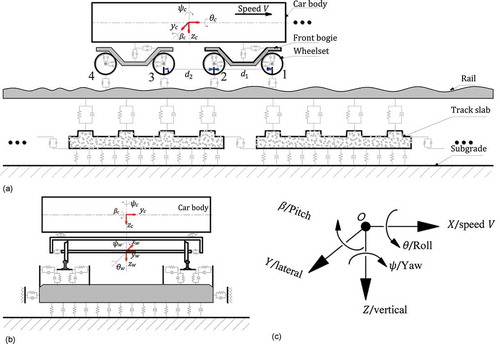
Figure 2. Wheel-rail interaction model: (a) Side view, (b) Top view
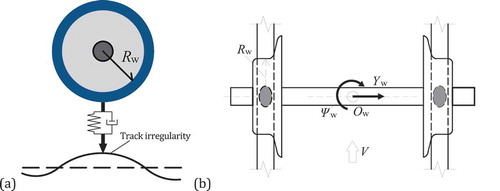
Figure 3. Comparisons between time-domain and frequency-domain solutions: (a) Car body vertical acceleration, (b) Wheel-rail vertical force
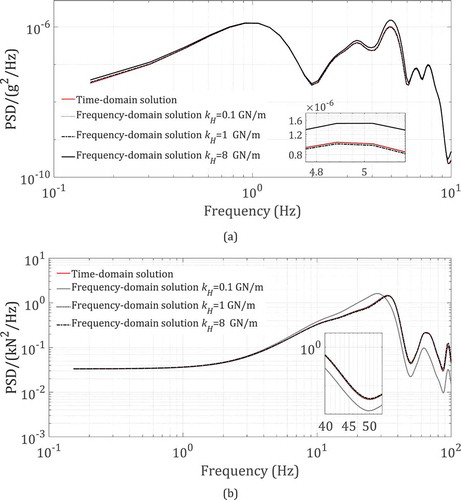
Figure 4. Car body response: (a) Rigid track, (b) Track flexibility included
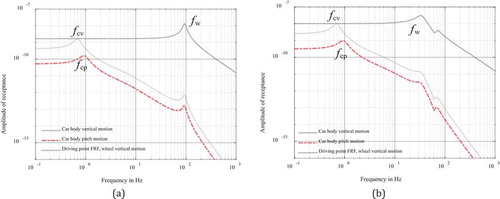
Figure 5. Front bogie response: (a) Rigid track, (b) Track flexibility included
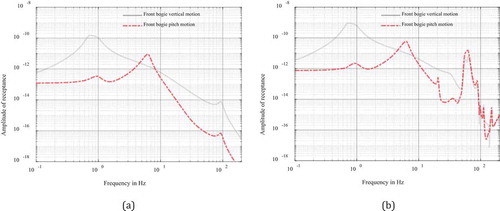
Figure 6. Rear bogie response: (a) Rigid track, (b) Track flexibility included
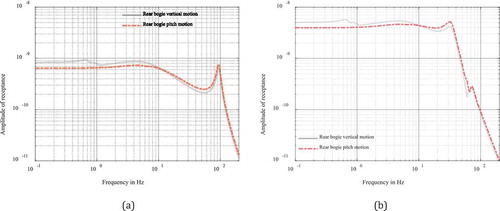
Figure 7. Carbody vertical motion, normalized with respect to : (a) Response of car body vertical motion in
and
plane, (b) Frequency response of car boy vertical motion for certain wavelengths of irregularities
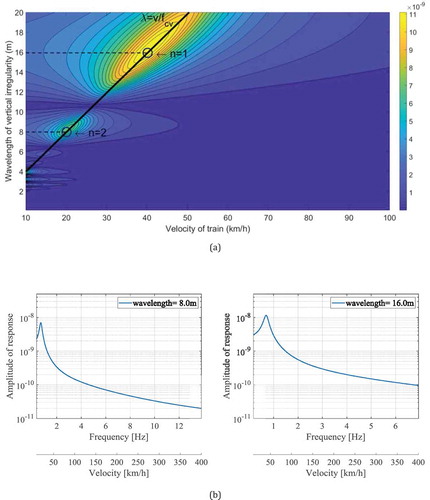
Figure 8. Car body pitch motion, normalized with respect to : (a) Response of car body pitch motion in
and
plane, (b) Frequency response of the car body pitch motion for certain wavelengths of irregularities
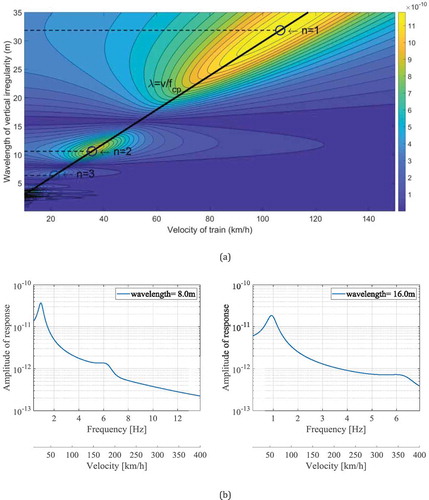
Figure 9. First wheelset vertical motion, normalized with respect to
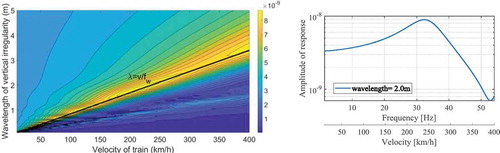
Figure 10. Second wheelset vertical motion, normalized with respect to

Figure 11. Third wheelset vertical motion, normalized with respect to
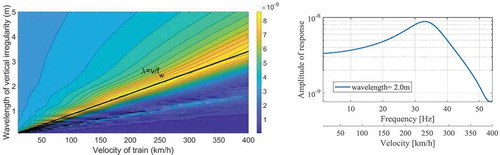
Figure 12. Fourth wheelset vertical motion, normalized with respect to
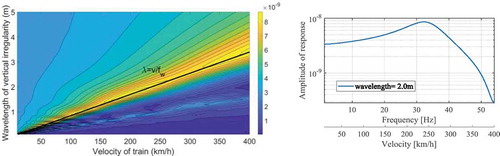
Figure 13. Driving point receptance of rail: (a) Driving point track receptance, without vehicle, the first peak is at 52 Hz, (b) Driving point track receptance, with vehicle, first peak at 33 Hz
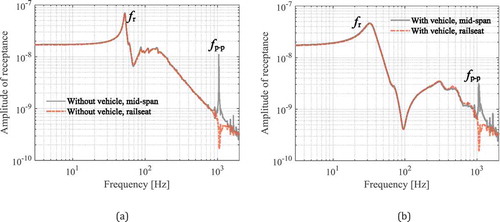
Figure 14. Vertical motion of rail under first wheelset, normalized with respect to

Figure 15. Vertical motion of rail under second wheelset, normalized with respect to

Figure 16. Vertical motion of rail under third wheelset, normalized with respect to
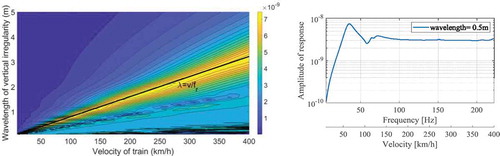
Figure 17. Vertical motion of rail under fourth wheelset, normalized with respect to
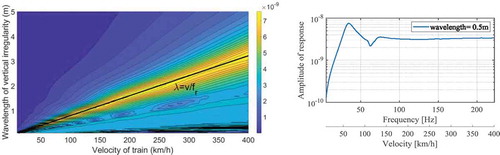
Figure 18. Car body response, normalized with respect to : (a) Vertical motion, (b) Pitch motion
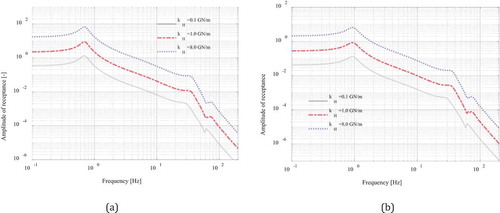
Figure 19. Front bogie response, normalized with respect to : (a) Vertical motion, (b) Pitch motion
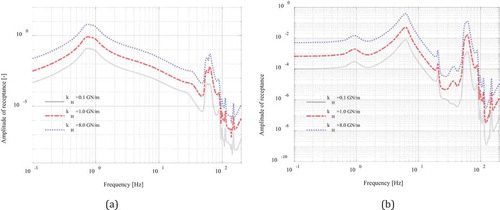
Figure 20. Rear bogie response, normalized with respect to : (a) Vertical motion, (b) Pitch motion
Figure 21. Driving point displacement FRF, wheel vertical motion, normalized with respect to
Figure 22. Rail vertical receptance, normalized with respect to
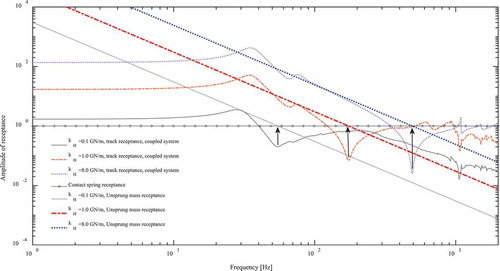
Figure 23. Influence of contact spring stiffness on the 1st resonance frequency of the rail
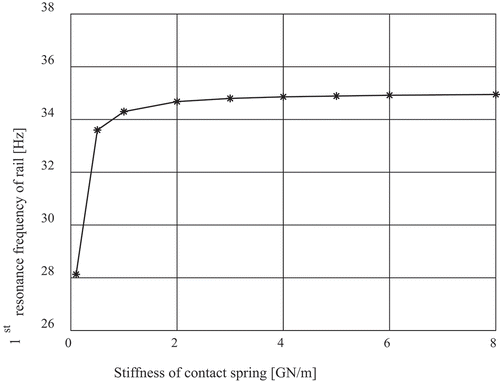
Table A1. Main parameters of the vehicle
Table A2. Main parameters of the track structures