Figures & data
Figure 1. Small network.
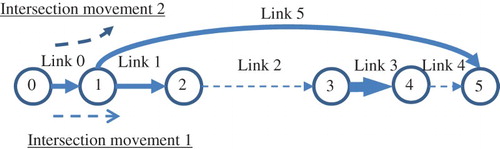
Table 1. Input data for example 1.
Table 2. Approach proportions and approach travel times under the DUO conditions.
Figure 2. Approach proportions associated with intersection movement 1 and minimum travel times of cars between nodes 1 and 5.
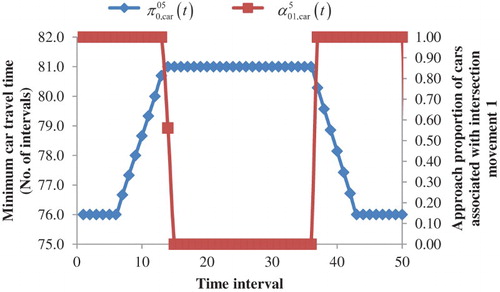
Figure 3. Effects of truck demand on the approach proportions and travel times of cars. (a) Effect of truck demand on the approach proportions of cars. (b) Effect of truck demand on the travel times of cars.
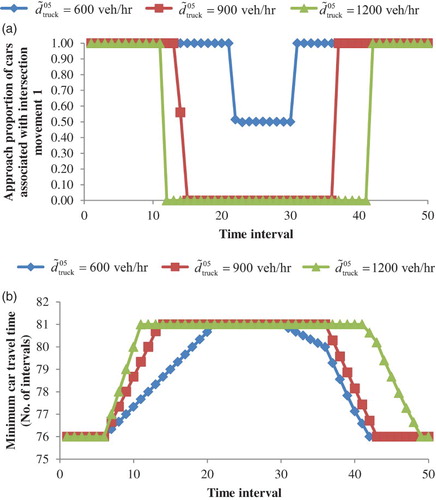
Figure 4. Effects of truck speed on the approach proportions and travel times of cars. (a) Effect of truck speed on the approach proportions of cars. (b) Effect of truck speed on the travel times of cars.
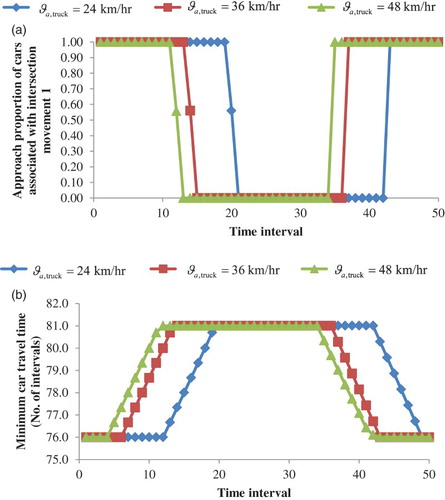
Table 3. Demand data.
Table 4. Occurrence of the multi-class paradox.
Table 5. Effects of truck demand and speed on the total car travel time.
Figure 5. Effects of truck demand on the occurrence of the paradox. (a) Effect of truck demand on the approach proportions of cars in OD pair 0–5. (b) Effect of truck demand on the minimum car travel time for OD pair 0–5. (c) Effect of truck demand on the minimum car travel time for OD pair 3–5.
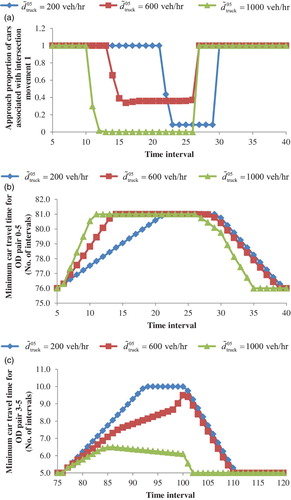
Figure 6. Effects of truck speed on the occurrence of the paradox. (a) Effect of truck speed on the approach proportions of cars in OD pair 0–5. (b) Effect of truck speed on the minimum travel time for OD pair 0–5. (c) Effect of truck speed on the minimum car travel time for OD pair 3–5.
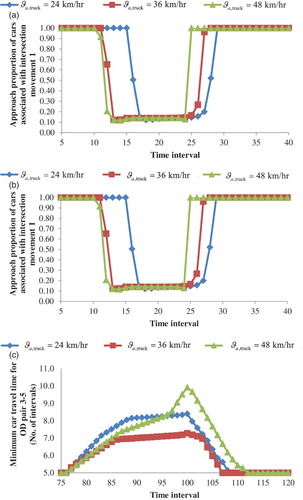
Figure 7. Nine-node small network.
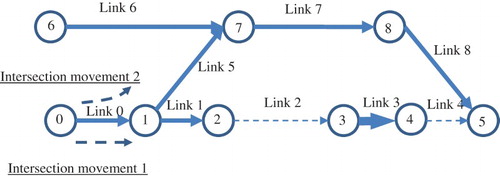
Table 6. Link data for Figure .
Table 7. Effect of background traffic levels on the occurrence of the paradox.
Table 8. Effect of background traffic levels on the performance of the solution algorithm.
Figure 8. The Nguyen and Dupuis network.
Figure 9. The Sioux Falls network.
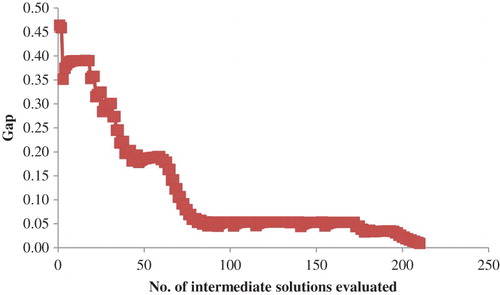
Figure 10. Convergence of the algorithm on the Sioux Falls network.