Figures & data
Figure 1. Illustration of the field of view concept as a function of the angle of sight and sight distance.
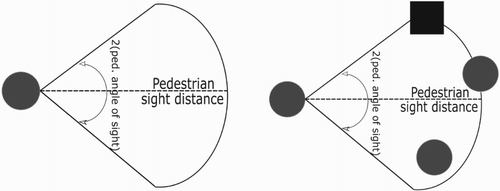
Table 1. Initially selected parameter sets.
Table 2. Top performing parameter sets.
Figure 2. Observed (left) and the simulated (right) trajectories.
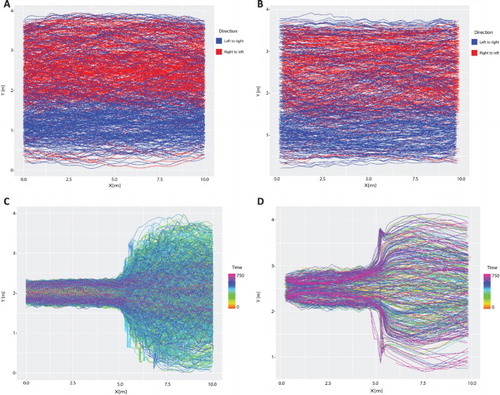
Figure 3. (A) Bidirectional flow–density diagram from experimental data and (B) bidirectional flow–density diagram from simulation.
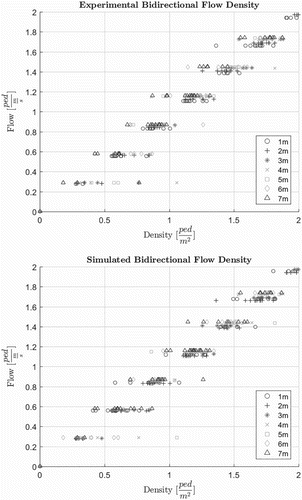
Figure 4. Narrow bottleneck flow–density diagram from simulation.
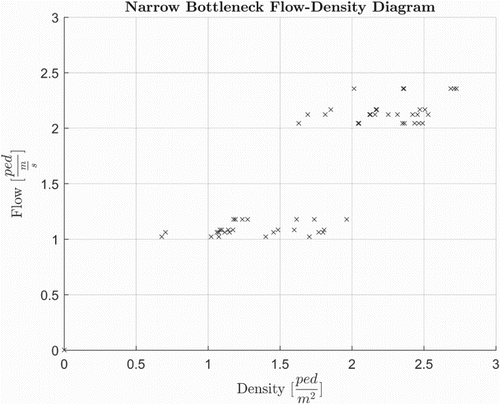
Figure 5. Transit station platform illustration.
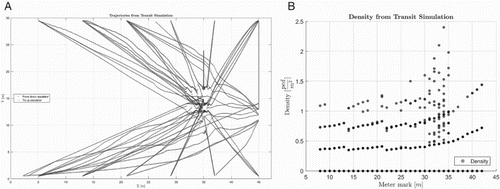
Figure 6. (A) Trajectories from transit simulation and (B) density plot from transit simulation.