Figures & data
Figure 1. Topological graph of the joint service.
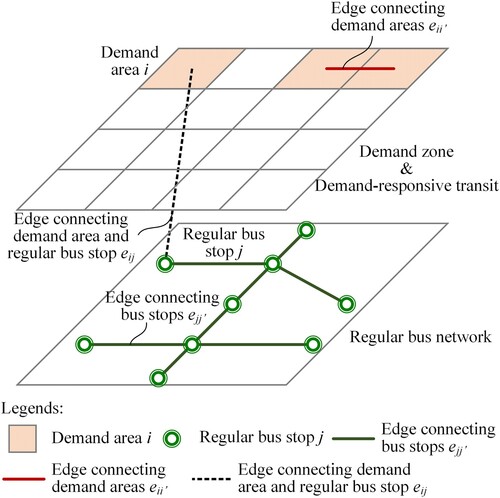
Table 1. Notation of key model parameters and variables.
Figure 2. Process of generating set of potential terminal bus stops for regular transit.
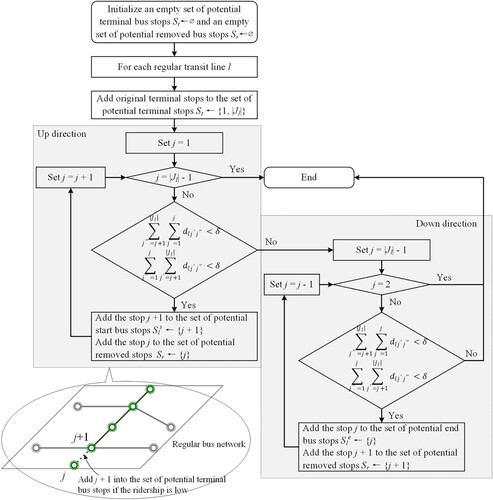
Figure 3. Process of generating set of potential serving areas for DRT.
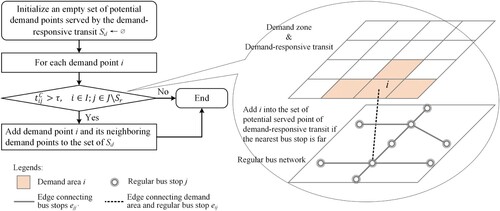
Table 2. Parameters reflecting the difference between the two types of transit service.
Figure 4. Main idea of the optimisation procedure.
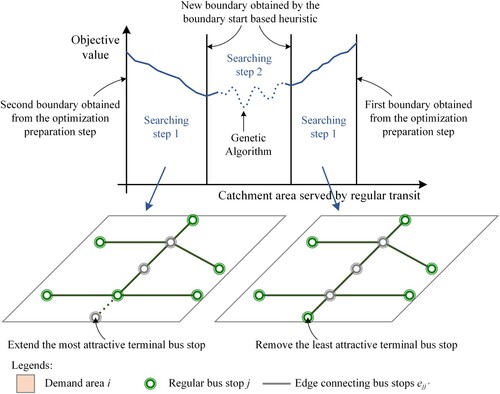
Figure 5. Flowchart for the solution procedure.
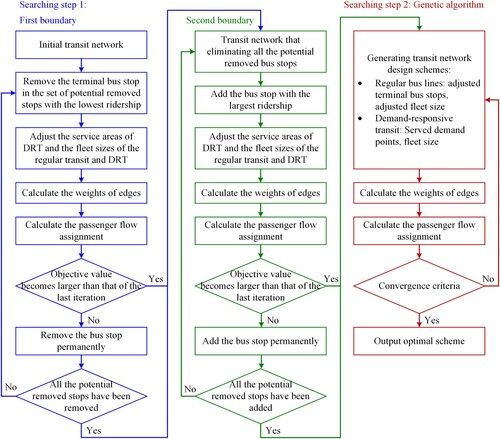
Figure 6. String of the solution.
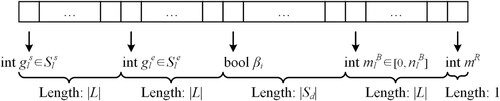
Figure 7. Passenger demand zones and original transit network of the case study.
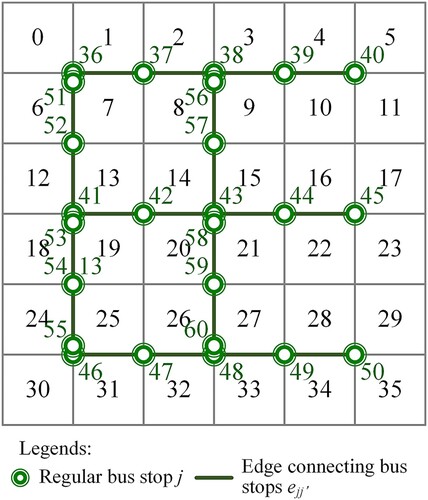
Table 3. Input data of the case study.
Figure 8. Original passenger demand flow distribution on regular bus lines.
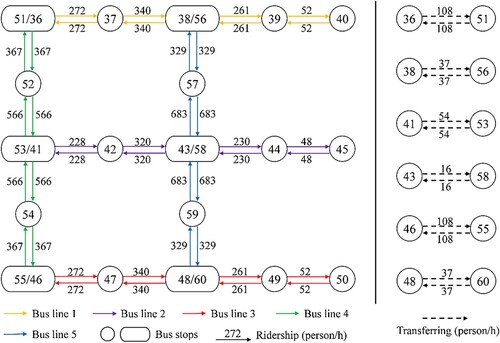
Table 4. Potential terminal bus stops and service zones.
Figure 9. Design schemes at each optimisation step.
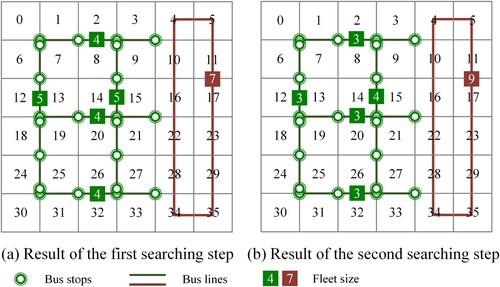
Figure 10. Convergence and computational time of the case study.
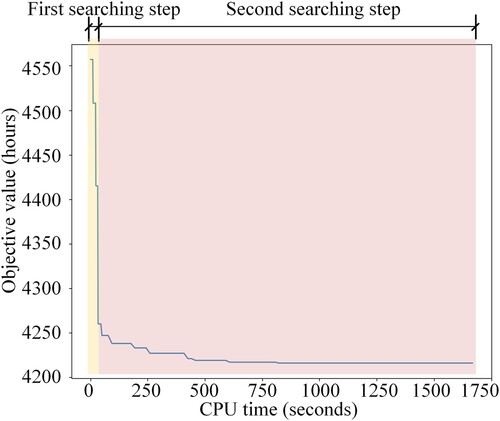
Table 5. Comparison with the optimisation method without the preparation step.
Table 6. Comparison with the optimisation method without boundary-start searching step.
Table 7. Comparison with two single-side optimisations.
Figure 11. Effect of the time-fleet size coefficient .
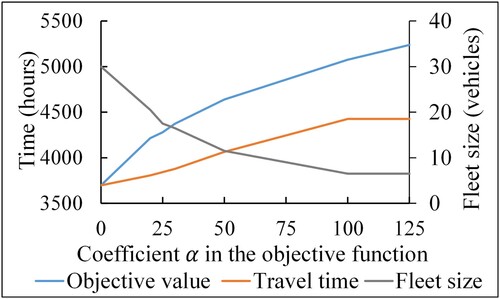
Figure 12. Effect of the waiting time coefficient for DRT .
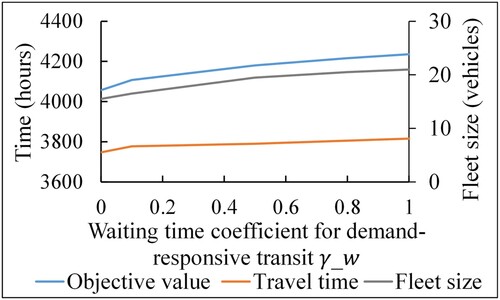
Figure 13. Effect of the threshold .
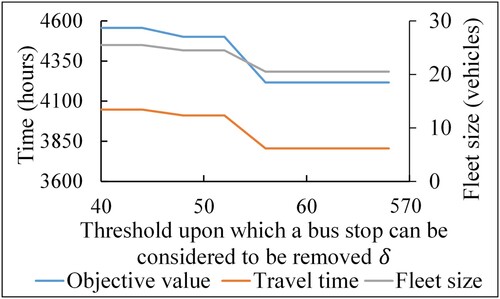
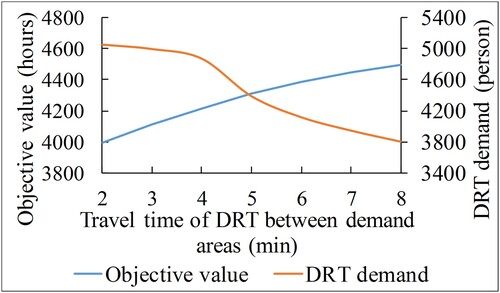
Figure 14. Effect of the travel time of DRT.