Figures & data
Figure 1. An example of how a building layout is represented as a spatial network.
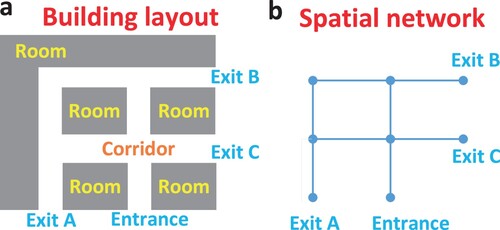
Figure 2. Generation of spatial networks: (a) a regular grid with 25 nodes arranged; (b) adjusting the regularity of the grid of nodes; (c) the Gabriel graph based on the nodes; (d) reduced Gabriel graphs with a lower average degree.
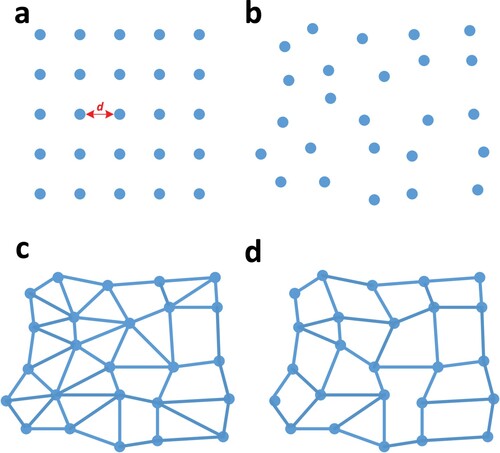
Figure 3. Distributions of building layout properties (the definition of properties can be found in Table ).
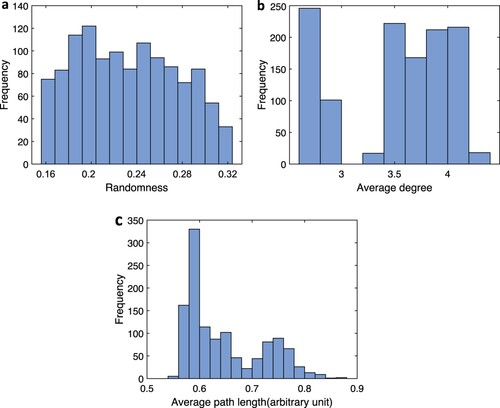
Table 1. Summary of the measures of building layout and route properties.
Figure 4. Still images of the virtual experiment as seen by participants on screen for the first task (a) and the second task (b).
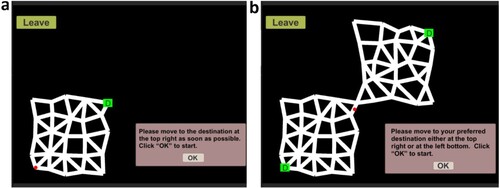
Figure 5. Distributions of route properties as shown in Table .
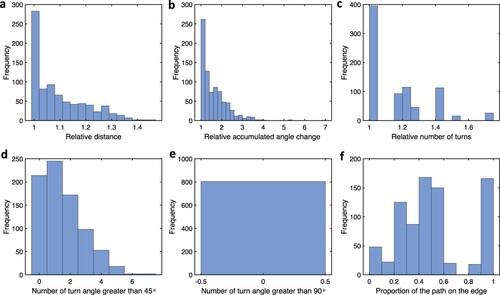
Table 2. Statistical analysis of the behaviour of pedestrians walking along the periphery of spatial networks.
Figure 6. Distributions of measures for route recall in the first task of the experiment. (a) shows the route similarity measure, (b) the difference in length, and (c) shows the difference in accumulated angle change between the initial route and the recalled route. Negative values in (b,c) indicate that the initial route was longer or had a higher value of the accumulated angle change, respectively.
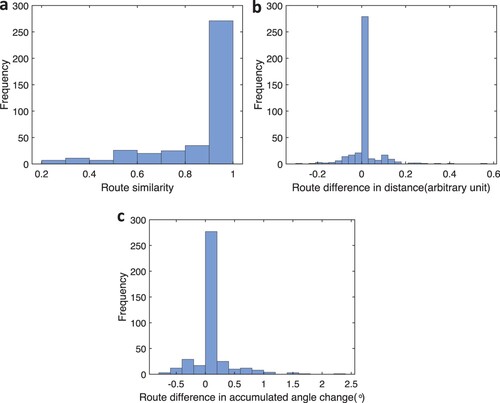
Table 3. Statistical analysis of route similarity.
Table 4. Statistical analysis of distance using a standard linear model.
Table 5. Statistical analysis of the accumulated angle change.
Table 6. Statistical analysis of building layout preference.
Figure A1. Still image of the virtual experiment as seen by participants on screen before route choice tasks start.
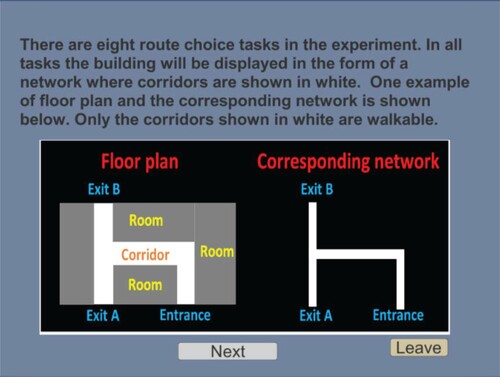
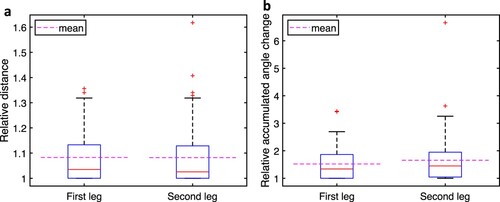
Figure A2. Route comparison of the first and second leg for the participants who selected different destinations in the second task of the experiment. Dashed horizontal lines show the mean of the data.