
Figures & data
Figure 1. Survey outline for the three choices within one choice set.
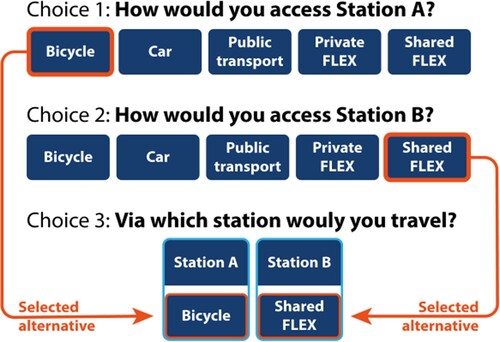
Table 1. SP survey prior values and attribute levels.
Table 2. Attitudinal statements on FLEX-related characteristics.
Table 3. Service of the sharing economy, including examples, as presented to respondents.
Table 4. Socio-demographics of the sample and the Dutch population (Centraal Bureau voor de Statistiek Citation2020).
Figure 2. Modal split of the initially selected access modes (inner ring) and access modes selected for the actually chosen station (outer ring), for the local and distant station separately and combined.
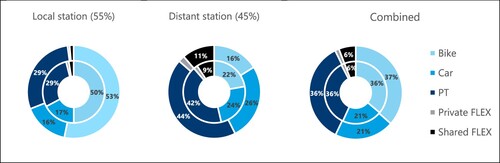
Figure 3. Results of the attitudinal statements.
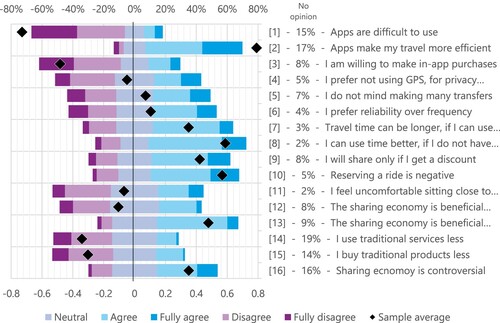
Figure 4. Familiarity with different sharing economy services.
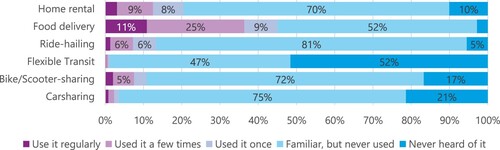
Figure 5. Exploratory factor analysis factor loadings for the four factors.
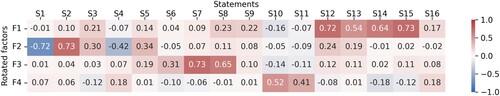
Figure 6. Mode-based and station-based nesting structure of choices.
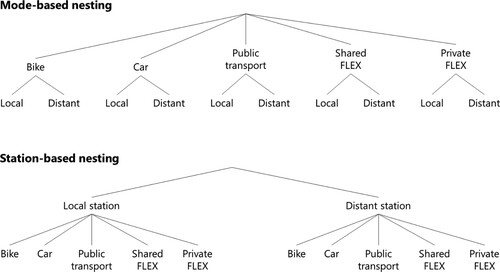
Table 5. Segmentation structure and corresponding segment sizes.
Table 6. Model fit, estimates of the taste, nest and class allocation parameters.
Figure 7. Weekly mobility patterns of the entire sample and the 4 classes (values below 5% are not labelled).
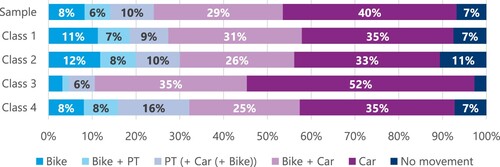
Table 7. Parameter trade-offs for different segments.
Table 8. Average factor scores and socio-demographic characteristics of the sample and each segment.
Figure 8. The impact of the Introduction and Substitution scenarios on modal split for train station access.
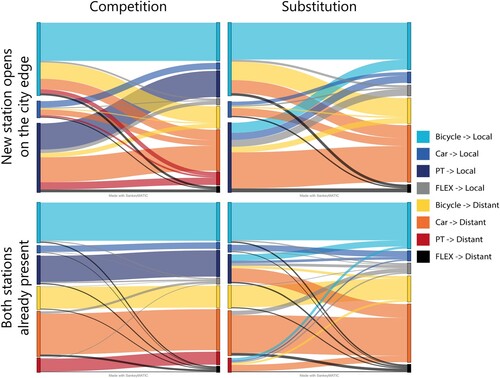
Figure 9. Market share for FLEX and Distant station when varying the average travel speed of FLEX and the distance between the two stations.
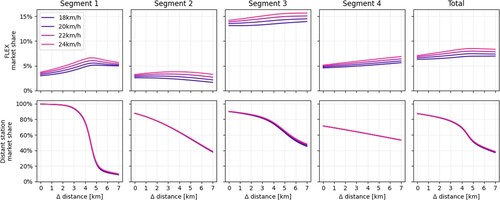
Figure 10. Market share for FLEX and Distant station when varying the number of transfers saved by travelling via the distant station and the distance between the two stations.
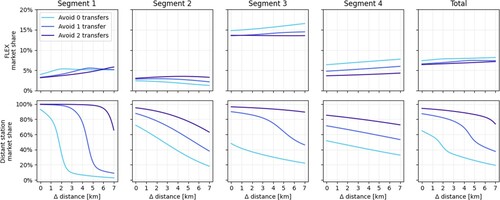
Figure 11. Example choice set of Choice 1 (and Choice 2).
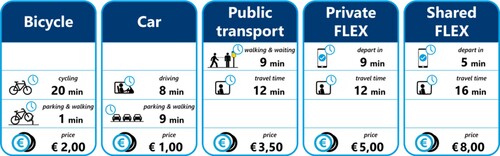
Figure 12. Example choice set of Choice 3.
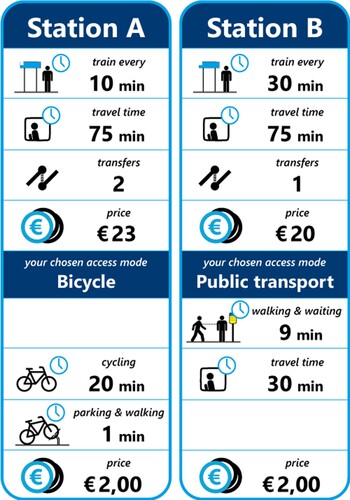
Table 9. Model fits of non-nested, nested, cross-nested and latent-class nested logit models.
Figure 13. Example trip options (left): Via local train station; right via IC train station.
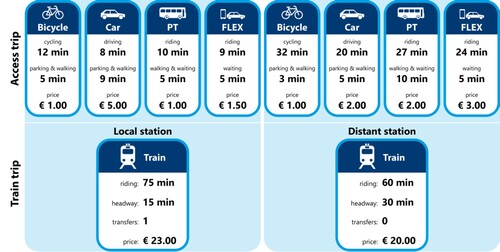
Table 10. Results of the sensitivity analysis.