Figures & data
Table 1. Summary statistics on the combined dataset from the three surveys.
Table 2. Truck types and number of trips based on origin and destination (OD) location (inter-city trips).
Figure 1. Distribution of commodity groups with truck type for inter-city trips from Addis Ababa.
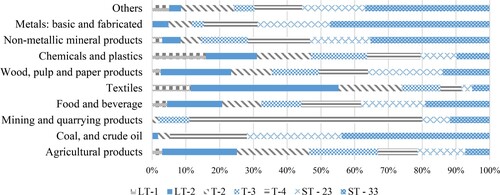
Table 3. Inter-sector (IS) flows of inter-city trips in the combined datasets.
Figure 2. Discrete-continuous model framework with integrated choice and latent variable model (adapted from Ben-Akiva and Boccara (Citation1995)).
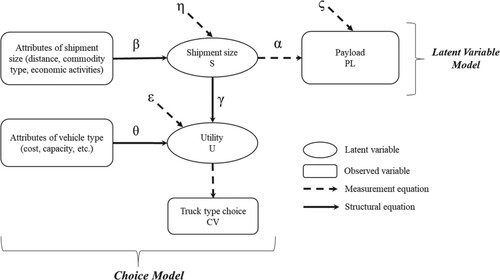
Table 4. Integrated choice and latent variable (ICLV) model estimates for truck type-shipment size choices.
Figure 3. Overall shipment size-trends.
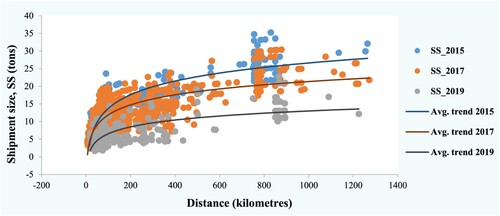
Table 5. Cross-tabulation of the repeated K-fold cross-validation (5-fold, repeated 10×) results.
Table 6. The elasticity of the truck choice model with changes in operating cost (Cwn) and unused capacity (Vn).
Figure 4. Latent growth curve for different truck types.
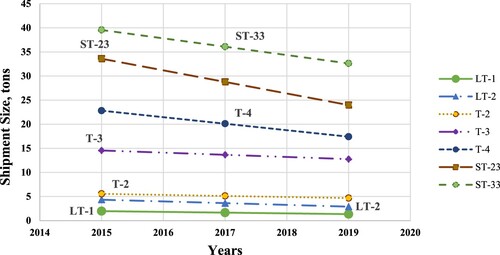
Table 7. Latent growth (LG) model estimates of shipment size for each truck type.
Figure 5. Economic metrics for Ethiopia, 2010/11–2020/21. (a) GDP, inflation, and growth of main sectors, and (b) trade growth and merchandise trade. (Data source: World-Bank (Citation2022)).
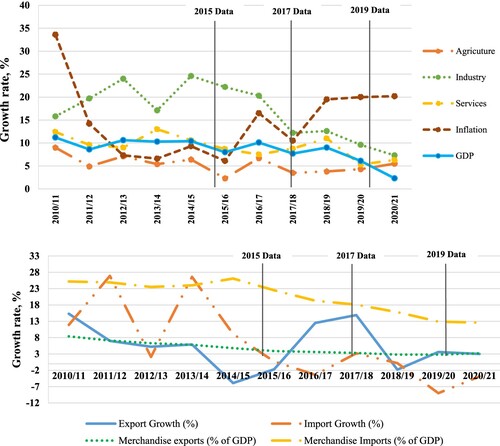
Table A1. The distribution of establishment categories in the freight flow (intercity trips).
Table A2. Average transport cost per ton-kilometres for each truck type over the years (in US$).
Figure A1. Map of Addis Ababa city showing locations used for data collection in the three surveys.
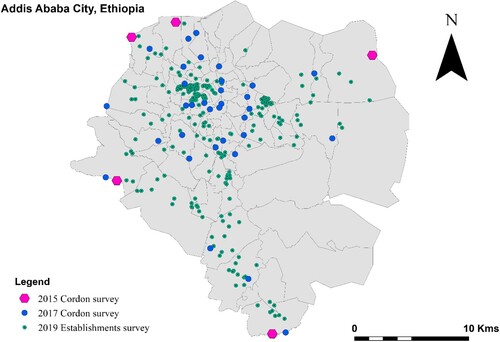
Figure A2. Cumulative distribution of three datasets with travel distance.

Figure A3. Complete path diagram of the shipment size growth curve model.
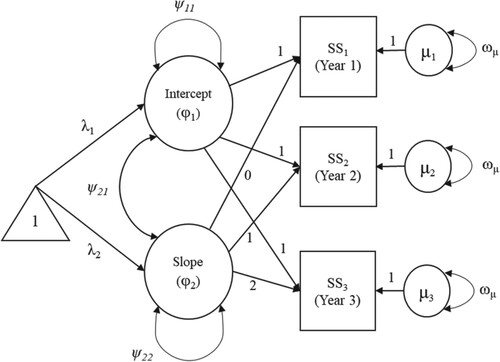
Figure A4. Commodity-specific shipment size trends with travel distance over data collection years 2015, 2017 and 2019. Note: the bars only indicate the time of major events and do not represent any scale.
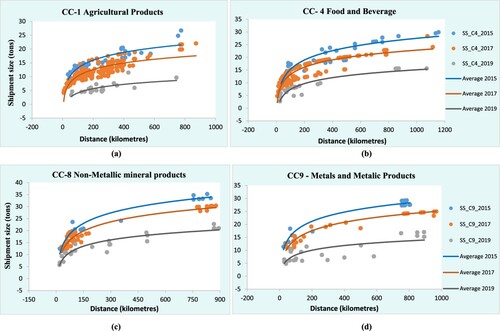
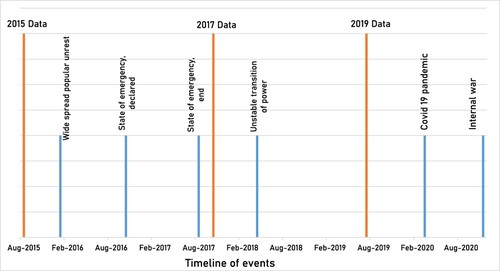
Figure A5. Ethiopia’s major socio-political events with a timeline between 2015 and 2020 (own depiction).