
Figures & data
Figure 1. A knowledge system for climate information co-generation. with respect to the south africa forest sector, examples of knowledge producers include statistics south africa and south africa weather service. examples of knowledge brokers include the department of agriculture fisheries and forestry, and the south africa national biodiversity institute. examples of knowledge users include forest enterprises and community based organisations.
Figure 2. Map of south africa depicting tree plantations, indigenous forests, and timber processing mills (Forestry South Africa: FSA Citation2021)
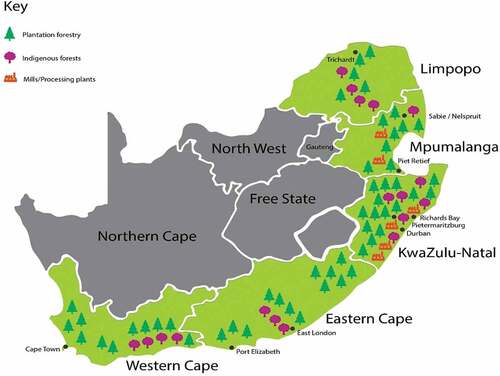
Table 1. Names of organisations that made up the climate information production network
Table 2. Timescale of forecasts used in decision making by forestry actors
Table 3. Forest based climate interventions and associated climate information
Figure 3. Extent of forest based interventions implementation by different category of actors
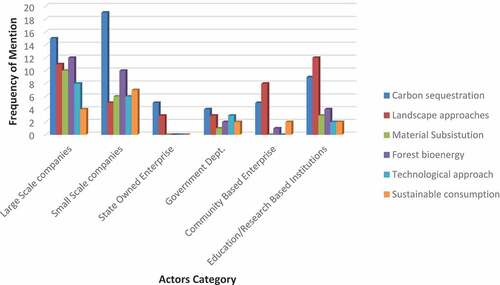
Table 4. Actors and their roles in climate information generation and adoption in forestry action
Figure 4. Climate information communication network representing relations among key actors in the intersecting field of forestry and climate change in south africa. nodes are coloured based on actors categorisation (green: community based forest enterprises, blue: education/research based institutions, pink: small scale forest companies, purple: industrial large scale companies, maroon: government departments). see table 1 for definition of acronym.
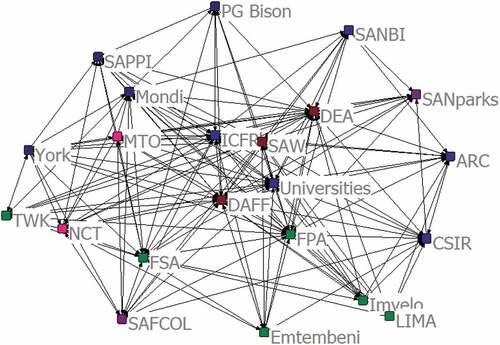
Table 5. Degree centrality and clustering coefficient of organisations in the climate information communication network