
Figures & data
Figure 1. BCI pipeline – The FASTER algorithm was employed to eliminate EOG and EMG artifacts from raw EEG signals. The absolute value of the Fast Fourier Transformation (FFTabs) was computed as a feature for each EEG channel using a 1-second window. With the feature Average method, the mean of the FFTabs was calculated for each channel within a specified frequency range, which could correspond to one of the canonical EEG bands (theta, alpha, beta, gamma). These features were utilized to train a Support Vector Machine (SVM). The feature range method builds upon and extends the feature Average method. The feature Average was computed for an odd number of distinct frequency bins, each 2 Hz wide. Each feature, corresponding to a frequency bin, was used to train a separate SVM, with the final classification result determined by taking the maximum vote of all SVM units.
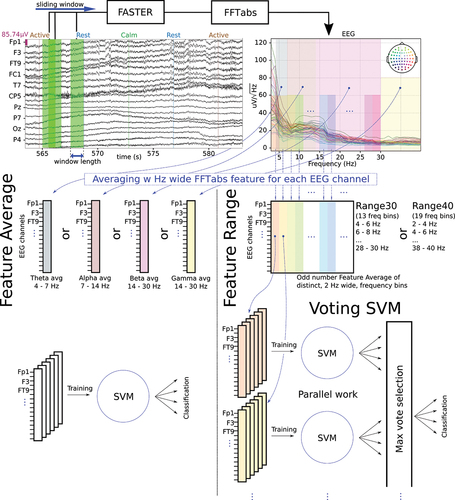
Figure 2. Two Choice Paradigm – It started with a one-minute open-eye and a one-minute closed-eye task, which served as a baseline and aimed to get the pilots’ full attention, preparing them for the MI sessions. Under one MI session, 8 active and 8 calm mental tasks were required from the pilots. The order of the tasks was randomized. The MI session was repeated 5 times under one experiment.
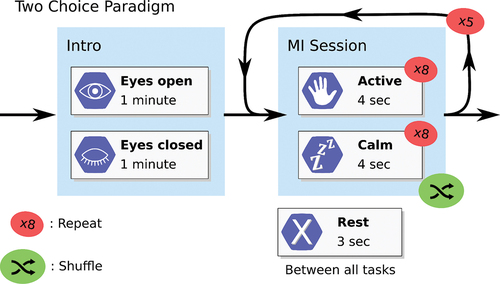
Figure 3. Components of our real-time BCI system and the Toggle Switch control mechanism.
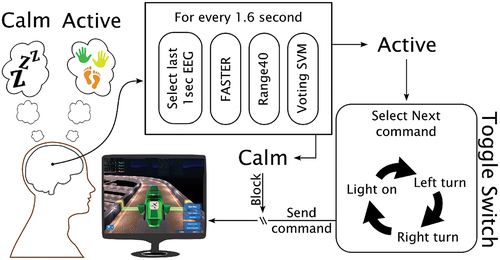
Figure 4. EEG band effect investigation – On both Physionet and the Two Choice Paradigm database, the impact of different frequency range based features were investigated and compared with each other statistically. The significant differences between the canonical EEG bands and the range30 and range40 methods are marked with stars. The p-value annotation legend is the following: *: ; **:
; ***:
; ****:
. The mean of the data is presented with the ’+’ symbol.
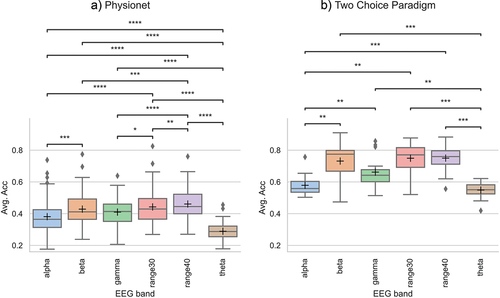
Table I. Statistical test results of main effect on EEG band investigation.
Figure 5. 5-fold cross-validated accuracy level comparison of range40 + Voting SVM with EEGNet. The p-value annotation legend is the following: non-significant (ns): ; ****:
. The mean of the data is presented with the ’+’ symbol.
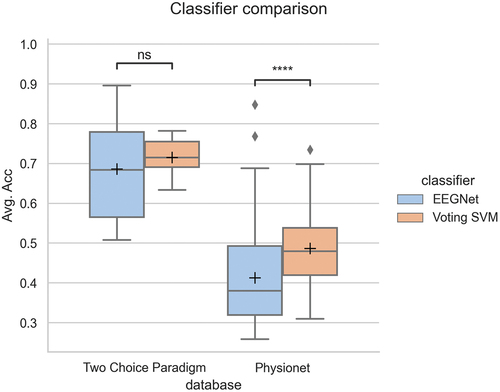
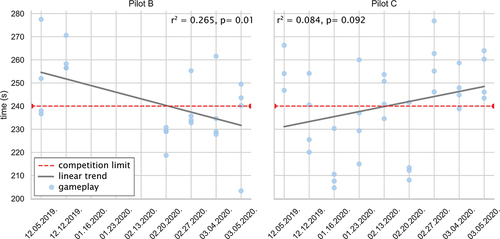
Figure 6. Gameplay performance of pilots per experimental day. 240 seconds were marked with a red line, which is the time limit defined by the organizers. The gray lines present the learning curves.
Supplemental Material
Download MS Word (1.9 MB)Data availability statement
The dataset analyzed during the current study is available from the corresponding author upon reasonable request.
The paradigm leader code can be found at https://github.com/kolcs/GoPar. For further details about the code, please read Supplementary Materials I.
Our BCI application’s source code is published at https://github.com/kolcs/bionic_apps.