
Figures & data
Table 1. List of variables for analysis.Footnote3
Table 2. Classification algorithm comparison.
Table 3. Regression algorithm comparison.
Figure 1. Confusion matrix for random forest classifier.
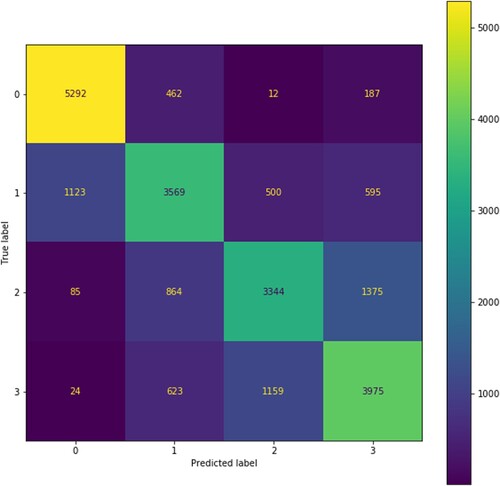
Table 4. Random forest classification report.
Figure 2. Feature importance based on random forest classifier.
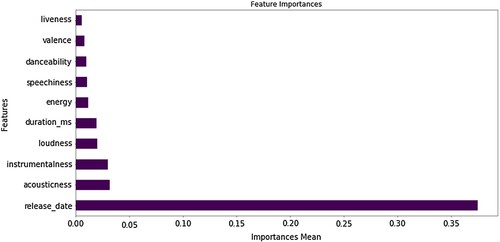
Table 5. Tukey's test from ANOVA Post Hoc.
Figure 3. Histogram plot of the audio features on the four popularity classes.
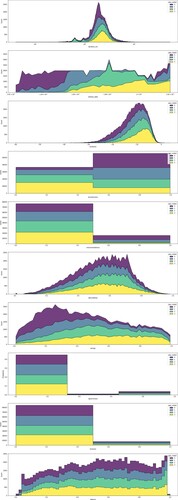
Table 6. Descriptive statistics for each class.