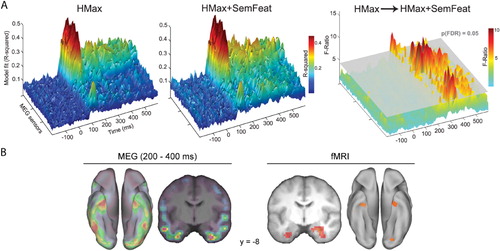
Figure 1. The temporal and spatial distribution of object-specific semantic feature information. (a) Model fit between the HMax model (left) and the combined HMax and semantic feature model (centre) to the MEG data over sensors and time. Right: significant increases in model fit are observed from 190 ms when including semantic feature information in addition to the HMax model. (b) Spatial distribution of semantic feature effects from MEG and fMRI, showing a correspondence in the anterior temporal lobes. MEG data in ‘a’ and ‘b’ reproduced from Clarke et al. (Citation2014), fMRI data in ‘b’ reproduced from Clarke and Tyler (Citation2014).
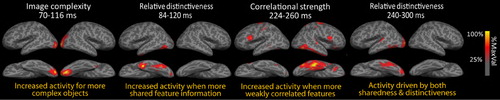
Figure 2. Modulation of object processing by visual and semantic feature-based statistics over time. Data show rapid visual and shared semantic-feature effects before later effects of both shared and distinctive semantic features. Redrawn from Clarke et al. (Citation2013).
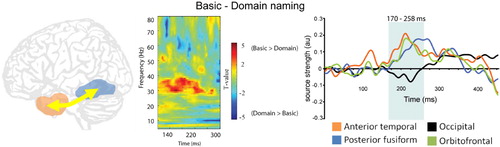
Figure 3. Recurrent interactions between the left anterior temporal and posterior fusiform increase when more specific semantic information is required. Left: Increased phase-locking between these regions during basic (e.g. tiger) compared to domain naming (i.e. living or nonliving). Right: increased activity in the anterior temporal lobe peaks ~200 ms and posterior fusiform peaks ~250 ms. Redrawn from Clarke, Taylor, and Tyler (Citation2011).
Clarke, A., Devereux, B. J., Randall, B., & Tyler, L. K. (2014). Predicting the time course of individual objects with MEG. Cerebral Cortex. doi:10.1093/cercor/bhu203
Clarke, A., & Tyler, L. K. (2014). Object-specific semantic coding in human perirhinal cortex. Journal of Neuroscience, 34, 4766–4775. doi:10.1523/JNEUROSCI.2828-13.2014
Clarke, A., Taylor, K. I., Devereux, B., Randall, B., & Tyler, L. K. (2013). From perception to conception: How meaningful objects are processed over time. Cerebral Cortex, 23, 187–197. doi:10.1093/cercor/bhs002
Clarke, A., Taylor, K. I., & Tyler, L. K. (2011). The evolution of meaning: Spatio-temporal dynamics of visual object recognition. Journal of Cognitive Neuroscience, 23, 1887–1899. doi:10.1016/S0042-6989(02)00298-5