Figures & data
Figure 1. The acoustic correlates measured in the pre-wh part of a declarative sentence. In the second panel, the solid line is the pitch contour and the dotted line is the regression line. “L” and “H*” represent the valleys and the peaks of the realised pitch accents. The second tier represents the word boundaries. In the pitch stylised panel, only the points designating L and H* are kept and the irrelevant points are deleted. The vertical side of the triangle shows the excursion size of the pitch accents which is computed by subtracting the F0 value of H* (the peak of the accent) from the F0 value of L (the valley of the accent). The non-stylised pitch contour is presented along with the regression line.
Figure 2. The acoustic correlates measured in the pre-wh part of a question. In the second panel, the solid line is the pitch contour and the dotted line is the regression line. “L” and “H*” represent the valleys and the peaks of the realised pitch accents. The second tier represents the word boundaries. In the pitch stylised panel, only the points designating L and H* are kept and the irrelevant points are deleted. The vertical side of the triangle shows the excursion size of the pitch accents which is computed by subtracting the F0 value of H* (the peak of the accent) from the F0 value of L (the valley of the accent). The non-stylised pitch contour is presented along with the regression line.
Figure 3. The seven gates of a declarative stimulus. The “L” and “H*” represent the valleys and the peaks of the realised pitch accents. The other tiers represent the gate boundaries. The letter g represents the word gate and the number designates the gate number.
Figure 4. The seven gates of a question stimulus. The “L” and “H*” represent the valleys and the peaks of the realised pitch accents. The other tiers represent the gate boundaries. The letter g represents the word gate and the number designates the gate number.
Table 1. Perception of intended sentence type across gates and sentence type.
Figure 5. Mean Aʹ scores across gates. CUV stands for complete unambiguous version of the stimuli.
Table 2. Results of pairwise comparison tests for response accuracy differences between gates (the result is based on Bonferroni correction test).
Figure 6. Mean reaction time (in seconds) across gates. CUV stands for the complete unambiguous version of the stimuli.
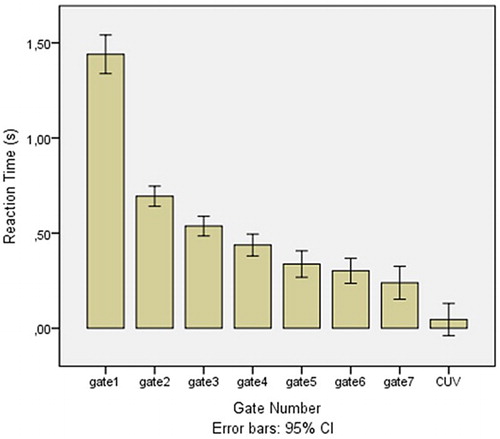
Table 3. Mean reaction time (and standard deviation) (in s) for declaratives and wh-questions across gates.
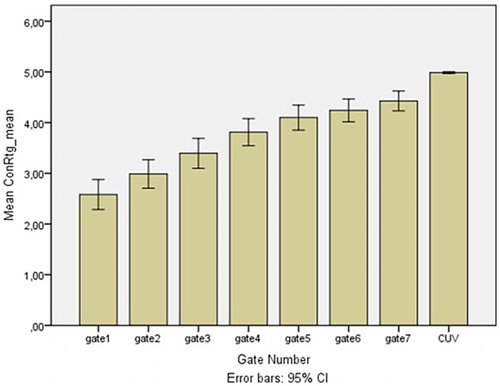
Figure 7. Mean confidence rating across gates. CUV stands for complete unambiguous version of the stimuli.