Figures & data
Table 1. Summary of lexical prediction studies, reporting ERPs on predicted noun gender mismatch.
Table 2. Examples of stimulus materials used in our experiment.
Figure 1. ERPs elicited by target determiners in the expected (black line) and unexpected (c) conditions on individual channels. NB: negative polarity is plotted downwards.
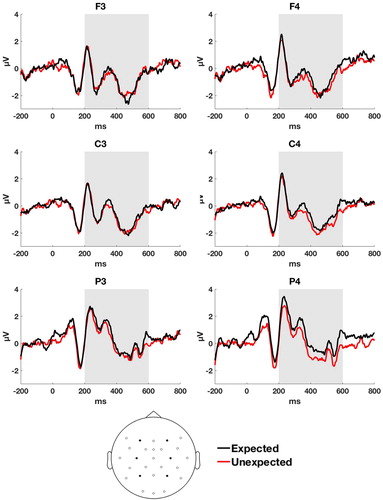
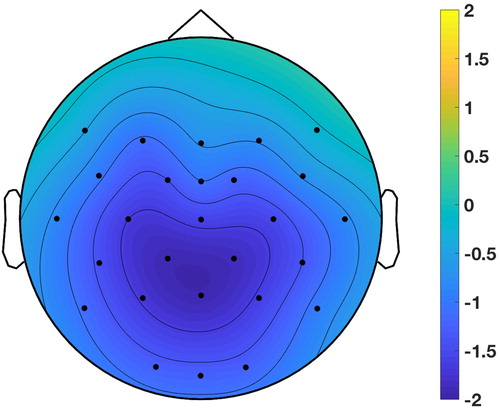
Figure 2. Topographic distribution of the difference between ERP amplitudes in the expected and unexpected conditions for target determiners, in the time-window 200–600 ms. The figure shows the ERP voltage of the unexpected determiner minus the expected determiner.
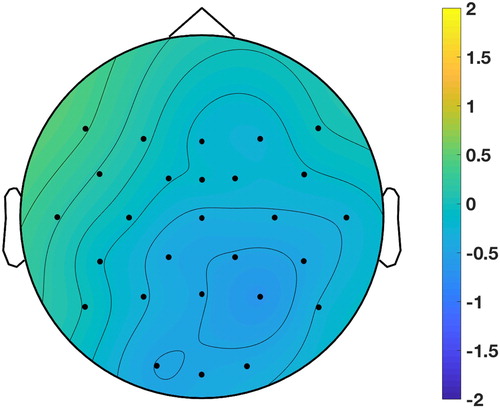
Figure 3. Results from the replication BF test. The dotted line represents the prior based on the effect size observed by O&vB, whereas the solid line represents the posterior belief in the alternative hypothesis after taking into account our observed effect. The grey dots represent believability of H0 before and after our data is taken into account. BFr0 is the ratio of the believability of H0 before and after our data is taken into account, it only slightly decreases with our data taken into account.
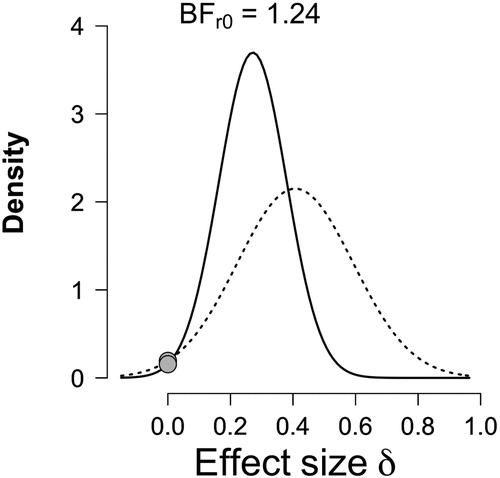
Figure 4. ERPs elicited by target nouns in the expected (black line) and unexpected (red line in online version, gray line in print version) conditions on individual channels. NB: negative polarity is plotted downwards.
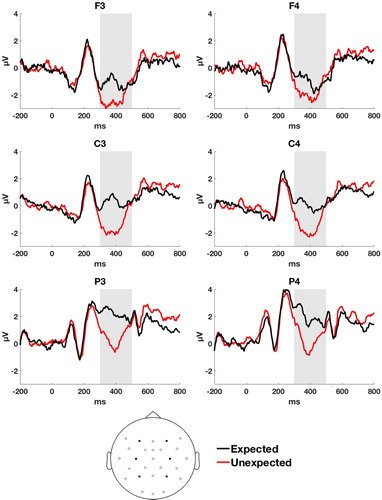
Figure 5. Topographic distribution of the difference between ERP amplitudes in the expected and unexpected conditions for target nouns, in the time-window 300–500 ms. The figure shows the ERP voltage of the unexpected noun minus the expected noun.