Figures & data
Figure 1. Higher resolution version of an example stimulus with minimal description length 2 to describe image #4.
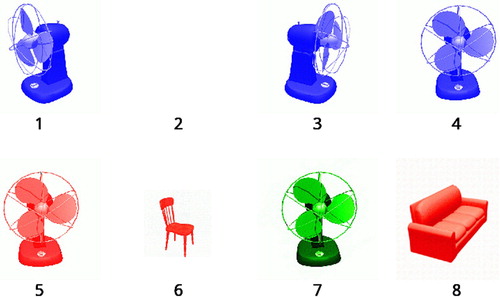
Figure 2. The driving simulator used for this experiment. Speaker-passengers described a target image from the image array displayed above the road. Listener-drivers had to follow the yellow bar back and forth across the road while identifying the intended referent by number.
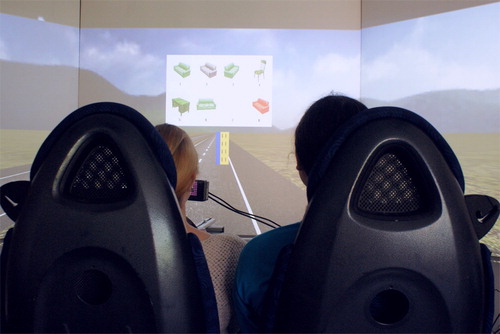
Figure 3. Schematic representation of the experimental design. The order of the blocks was counterbalanced across participants.
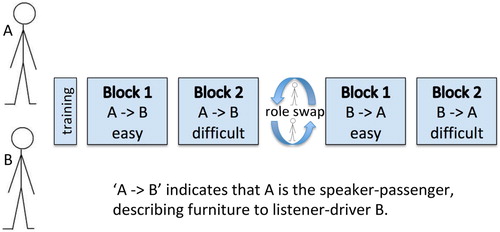
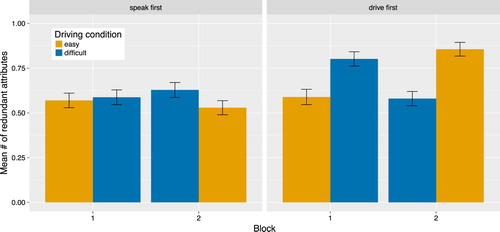
Figure 4. Degree of overspecification in speakers who described first (left) and speakers who had driven first (right) by driving condition and block. For an individual participant pair, if Block 1 had the easy driving condition, Block 2 had the difficult driving condition and vice versa, as indicated by the swapping of the colours in Block 2.