Figures & data
Figure 1. Example scene. The figure illustrates the living room scene, one of eight scenes used in this study. Participants, wearing 3D-glasses, stood in the middle of the room during the task and were allowed to move their heads to view the entire scene. The location of the two screens to the left and right gives the participants a feeling of being immersed in the scene. The virtual agent was always present on the middle screen, to ensure participants were able to locate her easily and would feel addressed when she spoke to them. The 6 objects present (mirror, piano, letter, shoes, door, and table in this specific scene) were placed in naturalistic locations and scaled to realistic proportions relative to the room. Participants heard four sentences while viewing this scene, two of which were restrictive (e.g. Tonight, I should remember to mail the letter) and two of which were unrestrictive (e.g. Tonight, I should remember to move the letter). In this case, a pre-test indicated that participants found the letter the only mail-able object in the scene, yet they found the letter, mirror, piano, shoes, and table moveable.
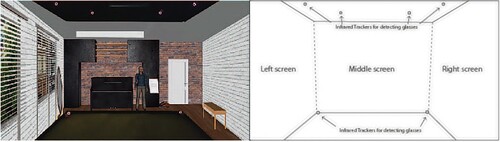
Figure 2. Mean proportions of fixations. A. To the target object and virtual agent. B. To the target and distractor objects shown per condition. Vertical lines indicate critical time points. 0 ms indicates verb onset, the label “start of critical window” is the start of the critical window (200 ms after verb onset). The main statistical analysis was performed on the interval between the start of the critical window and noun onset. Error clouds indicate standard error.
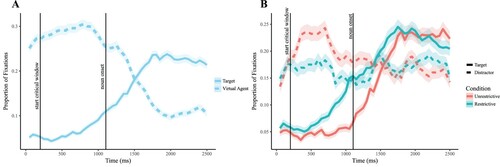
Table 1. Summary of the generalised additive mixed model for changes in target fixations over time, per condition (restrictive versus unrestrictive sentences) for Experiment 1.
Figure 3. Depiction of a correctly performed trial in the sequential comparison task. Dotted lines and arrow represent current eye position and the saccade response. Participants were required to maintain fixation on the central fixation spot until the spot turned grey, signalling that they were allowed to move their eyes. Adapted from Heyselaar et al. (Citation2011).
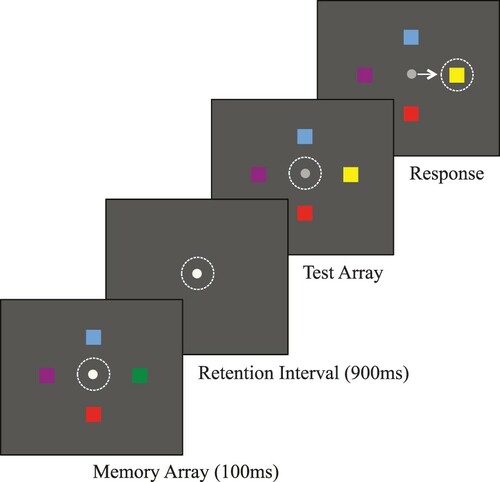
Figure 4. Mean proportions of fixations. A. To the target object and virtual agent. B. To the target and distractor objects shown per condition. Vertical lines indicate critical time points. 0 ms indicates verb onset, the label “start of critical window” is the start of the critical window (200 ms after verb onset). The main statistical analysis was performed on the interval between the start of the critical window and noun onset. Error clouds indicate standard error.
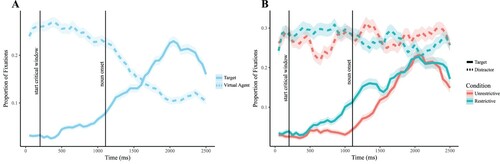
Table 2. Summary of the generalised additive mixed model for changes in target fixations over time, per condition (restrictive versus unrestrictive sentences) for Experiment 2 (More referents).
Table 3. Summary of the generalised additive mixed model for changes in target fixations per working memory capacity, per condition (restrictive versus unrestrictive sentences).
Figure 5. Mean proportions of target fixations for participants with low (<2.67 items) and high working memory capacity (>2.67 items), per condition. The analysis treated working memory capacity as a continuous variable and illustrates a significant effect of working memory on anticipatory eye movements for the restrictive condition (p < .001). Error clouds represent standard error.
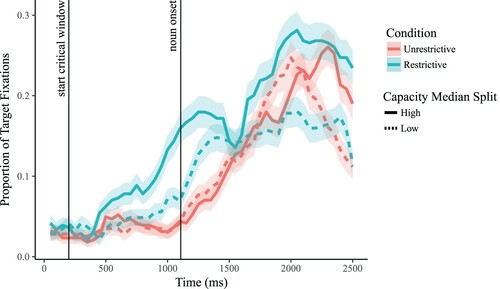
Figure 6. Mean proportions of fixations. A. To the target object and virtual agent. B. To the target and distractor objects shown per condition. Vertical lines indicate critical time points. 0 ms indicates verb onset, the label “start of critical window” is the start of the critical window (200 ms after verb onset). The main statistical analysis was performed on the interval between start of the critical window and noun onset. Error clouds indicate standard error.
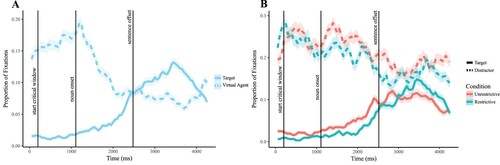
Table 4. Summary of the generalised additive mixed model for changes in target fixations over time, per condition (restrictive versus unrestrictive sentences) for Experiment 3 (Less predictable input).
Figure 7. Mean proportions of fixations. A. To the target object and virtual agent. B. To the target and distractor objects shown per condition. Vertical lines indicate critical time points. 0 ms indicated verb onset, the label “start of critical window” is the start of the critical window (200 ms after verb onset). The main statistical analysis was performed on the interval between the start of the critical window and noun onset. Error clouds indicate standard error.
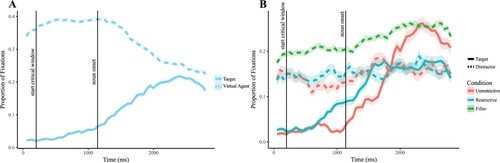
Table 5. Summary of the generalised additive mixed model for changes in target fixations over time, per condition (restrictive versus unrestrictive sentences) for Experiment 4 (Less attentional focus).
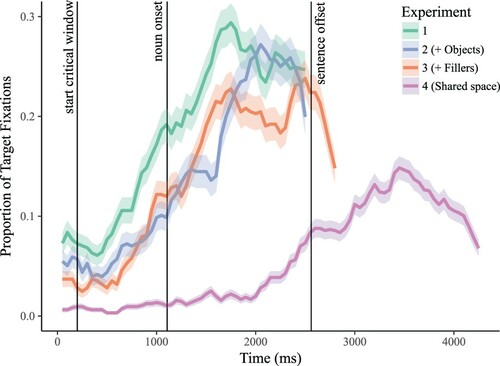
Figure 8. Mean proportions of fixations per experiment to the target object during the restrictive condition. Vertical lines indicate critical time points. 0 ms indicates verb onset, the label “start of critical window” is the start of the critical window (200 ms after verb onset). Experiment 1 induced significantly more fixations to the target object for both plots (p < .007). Error clouds represent standard error.