Figures & data
Figure 1. Histograms of article and noun cloze probabilities in the experiment.
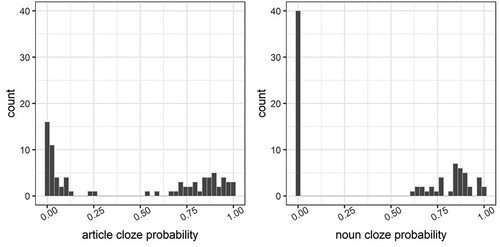
Table 1. Stimuli characteristics for the three adjectives inserted after the article.
Table 2. Examples of comprehension questions that were used in the self-paced reading experiment.
Figure 2. Accuracy rates during word recognition depending on encoding condition (predictable vs unpredictable). Black triangles indicate average values per condition.
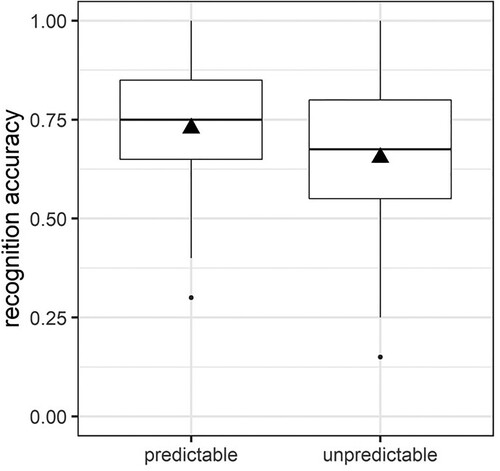
Figure 3. Accuracy rates during word recognition depending on encoding condition (predictable vs unpredictable) and subject-wise recognition scores (reflecting the discrimination between old and new items). Black triangles indicate average values per condition.
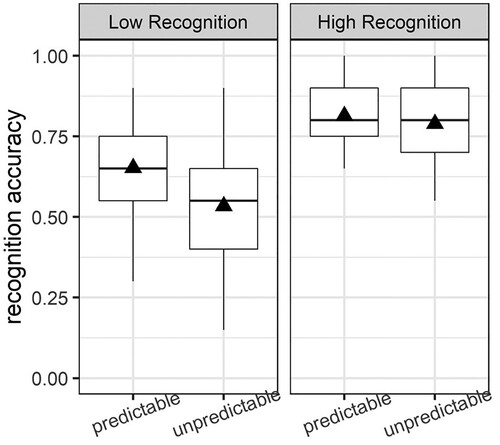
Figure 4. Residual (length-corrected) RTs for target words in predictable and unpredictable items, split out by high and low Pr recognition scores (note: all models were run with the scaled continuous variable). Words displayed correspond to the example item, When Paul finally got his driver’s license, he was always driving around with the old but reliable car/group of friends.
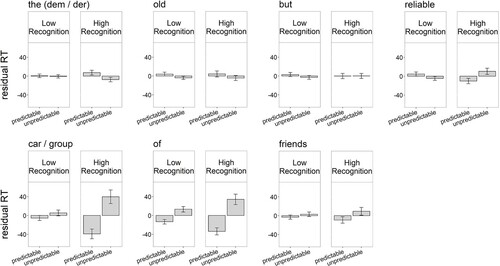
Table 3. Effect sizes (b), standard errors (SE), and t-values for models estimating the effects of condition and recognition scores on log-transformed RTs of the article, and the first and second word in the spill-over region (e.g. thearticle oldword 1 butword 2 reliable word 3 car/group).
Table 4. Effect sizes (b), standard errors (SE), and t-values for models estimating the effects of condition and recognition Pr scores on log-transformed RTs of the the third spill-over word, the noun, and the noun spill over region (e.g. … . reliable spill-over 3 car/group noun of noun spill-over 1).
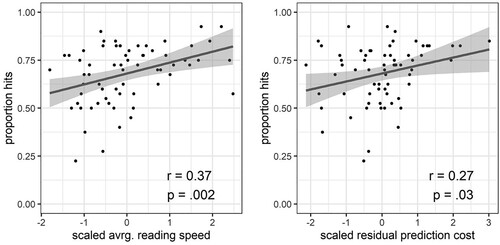
Figure 5. Correlation plots and Pearson correlation coefficients, illustrating the relationship between residualized reading times during encoding (left panel: average RTs per subject for sentence-early words; right panel: prediction cost at word spill 3 (i.e. reliable) per subject) and recognition memory.