Figures & data
Table 1. Example experimental stimuli.
Table 2. Response accuracy (and standard error) to comprehension questions in Experiment 1.
Figure 1. Mean eye-tracking measures at the verb with 95% confidence intervals (CI). (A) Go-past time. (B) Probability of re-reading. (C) Total reading duration.
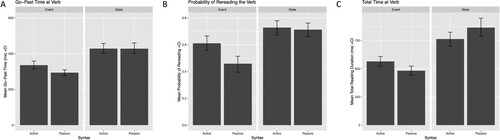
Table 3. Mean (and standard error) for each reading time measure across regions in experiment 1 and 2.
Figure 2. Mean eye-tracking measures at the first adjective region with 95% confidence intervals (CI). (A) Gaze duration. (B) Re-reading duration. (C) Total reading duration.
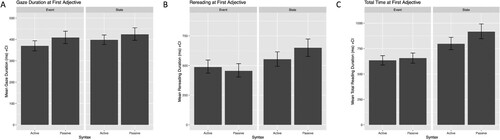
Figure 3. Mean eye-tracking measures at the postverbal noun with 95% confidence intervals (CI). (A) Probability of re-reading. (B) Total reading duration.
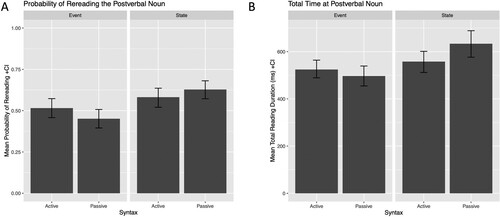
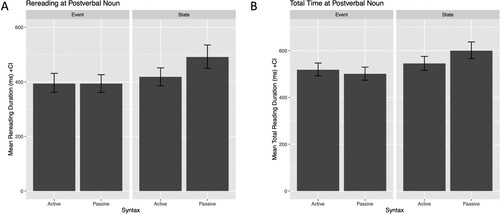
Figure 4. Mean re-reading duration at the postverbal noun with 95% confidence intervals (CI).
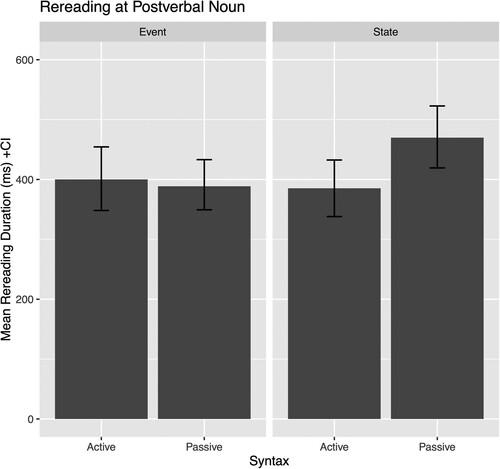
Figure 5. Mean probability correct answer with 95% confidence intervals (CI).
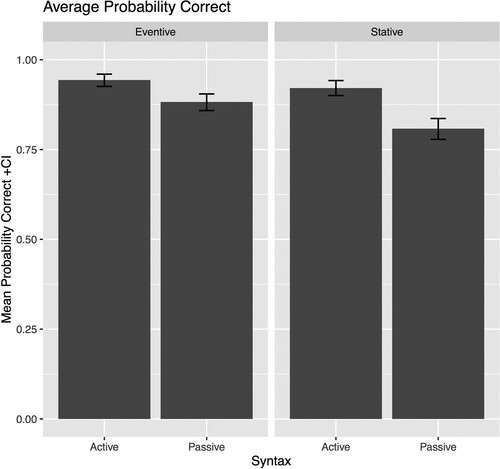
Figure 6. Mean eye-tracking measures at the verb with 95% confidence intervals (CI). (A) Go-past time. (B) Probability of re-reading. (C) Re-reading duration. (D) Total reading duration.
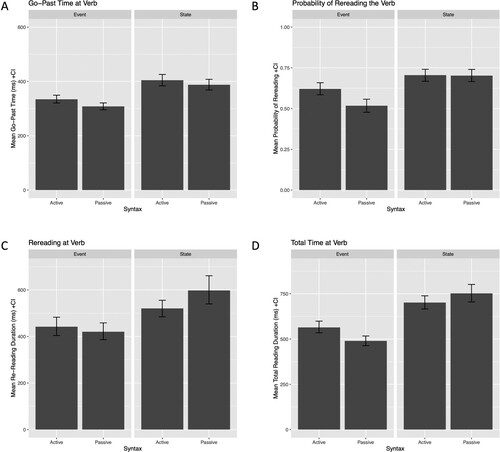
Table 4. Statistical results for each eye-tracking measure and region from the pooled data analysis.
Figure 7. Mean eye-tracking measures at the first adjective with 95% confidence intervals (CI). (A) Gaze duration. (B) Probability of regression out. (C) Total reading duration.
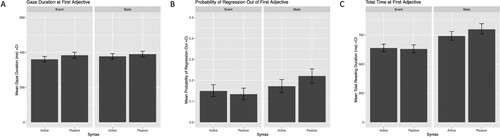
Figure 8. Mean eye-tracking measures at the postverbal noun with 95% confidence intervals (CI). (A) Re-reading duration. (B) Total reading duration.