
Figures & data
Table 1. Cochlear implant-using (CI) subject characteristics.
Figure 1. Single trial design. Subjects were presented with an audiovisual clip of a woman saying a word for 900-1930ms, followed by an ISI of 400 ms, a picture that lasted 1000 ms and an ITI of 1300 ms. The pictures either semantically matched the spoken word (congruent condition) or did not match the spoken word (incongruent condition).
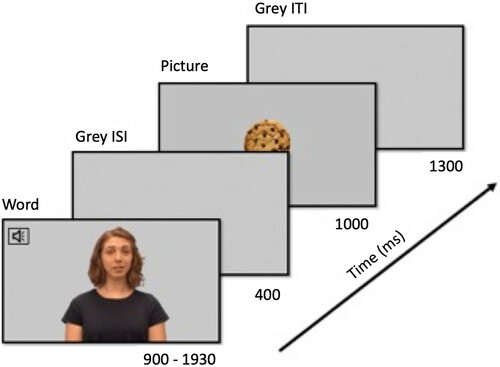
Figure 2. Grand-averaged event-related potentials (ERPs) for congruent and incongruent picture targets in each group. The average of these nine channels in the frontocentral region of interest were used in all statistical analyses.
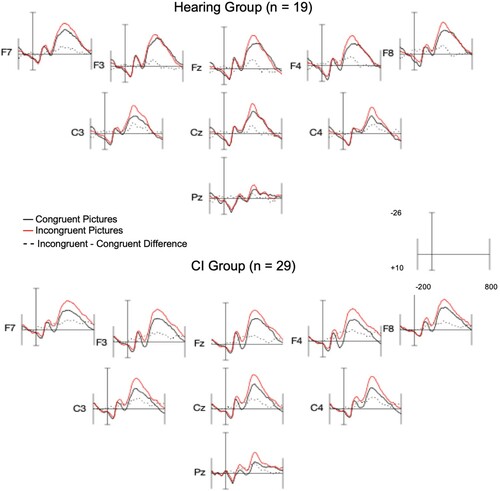
Table 2. Group comparisons of electrophysiological responses.
Figure 3. Grand-averaged response of CI group (n = 29) in channel Cz demonstrates windows of interest for early sensory (P2-like) component (150-275 ms post-picture onset) and N400 effect (300–500 ms post-picture onset). The red waveform represents responses to Incongruent pictures and the black waveform represents responses to Congruent pictures. The dotted line is the difference wave (Incongruent – Congruent).
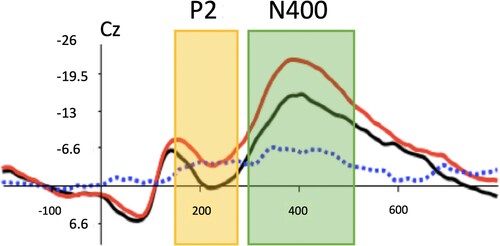
Table 3. Summary of ANOVA results for P2 effect size, P2 latency, and N400 effect size.
Figure 4. Mean amplitude of responses (measured in microvolts) 300–500 ms post picture-onset by condition and group. CI = Cochlear Implant, HG = Hearing. A significant main effect of Condition was found (p < .001), along with a significant interaction of Condition * Group (p < .01). Incongruent picture responses were significantly more negative for CI children than hearing children (p < .01).
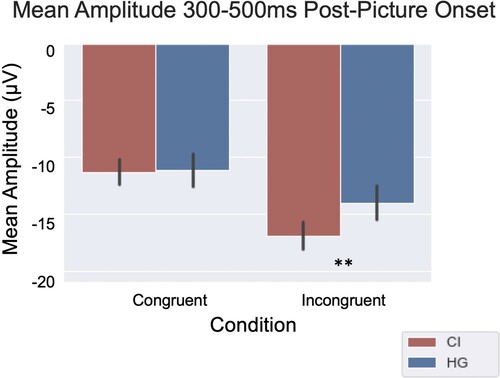
Table 4. Summary of ANOVA results for Mean Amplitude from 300 to 500 ms post-picture onset (n = 48); df = degrees of freedom, MSE = mean squared error.
Figure 5. Mean amplitude of responses (measured in microvolts) 300–500 ms post Incongruent picture-onset by Region. CI = Cochlear Implant, HG = Hearing. Neither group showed a significant difference in mean amplitude of responses between Central and Frontal regions. There was no difference in N400 mean amplitude between Parietal regions across groups, p = .0929.
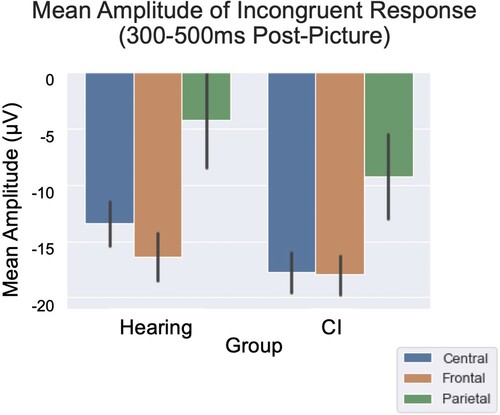
Figure 6. Association of P2 Effect and Age by Group. Each point represents the average P2 effect size per subject across all 9 electrodes. We observed a significant negative correlation between P2 effect magnitude and chronological age in the CI group only, (R = −0.312, p < .001). This correlation was not detected for the HG group (R = 0.048, p = .535).
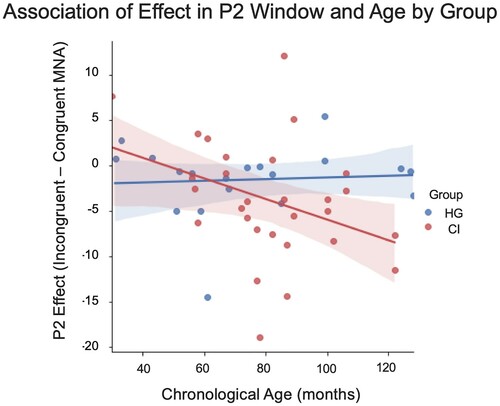
Table 5. Pearson correlation coefficients for neural responses and behavioural indices.
Supplemental Material
Download MS Word (18.6 KB)Data availability statement
The data that support the findings of this study are available on request from the corresponding author. The data are not publicly available due to privacy and ethical restrictions.