Figures & data
Figure 1. Example of stimuli in the picture-word interference task. The target word “Banane” (banana) with a semantically related (Aprikose/apricot), semantically unrelated (Streichholz/match), phonologically related (Banjo/banjo), and phonologically unrelated (Schwager/brother-in-law) distractor. Note that two unrelated conditions were used so as to have the same distractor lists when contrasting a related and unrelated condition.
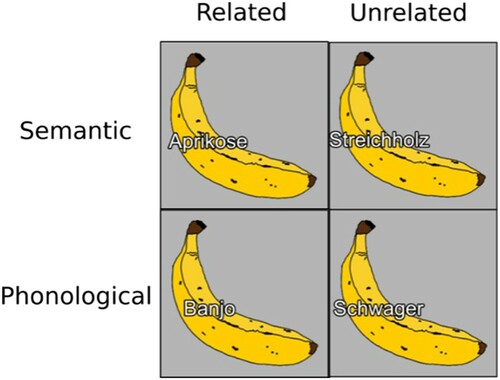
Table 1. Mean number of trials, standard deviation (sd), minimum (min), and maximum (max) per condition remaining after artifact rejection.
Figure 2. Stimulus-locked ERPs averaged over all participants and conditions: a) topographies at randomly selected time windows; b) waveforms at various electrodes.
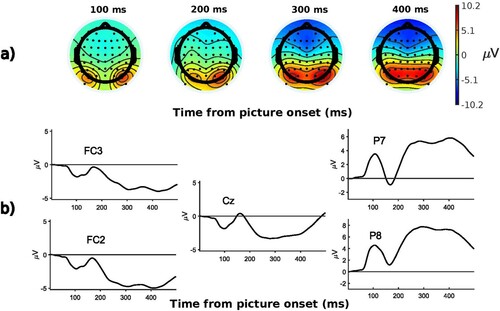
Figure 3. Response-locked ERPs averaged over all participants and conditions: a) topographies at randomly selected time windows; b) waveforms at various electrodes.
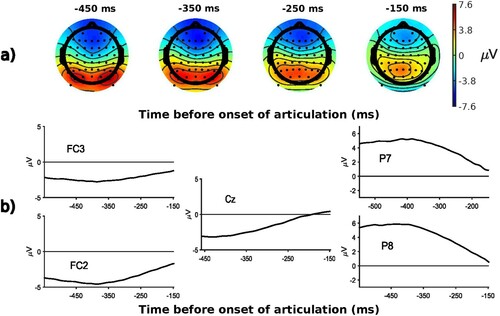
Figure 4. Picture-word interference task: observed mean naming latencies and standard errors (values are adjusted for within-participant designs following Morey, Citation2008) for each condition.
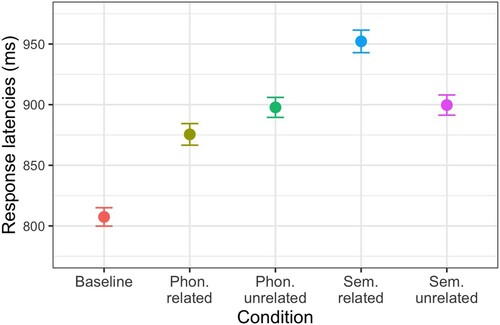
Table 2. Output of Analysis 1. Mixed-effects models testing the phonological, semantic, and general interference contrasts.
Figure 5. A. Density plot and B. boxplot showing the distributions of by-participant mean reaction times in each task. C. Density plot and D. boxplot showing the distributions of by-item mean reaction times in each task. Similar variance was observed between the two tasks for participant analysis, but variance differed in the two tasks (greater variance in immediate task than delayed) for item analyses.
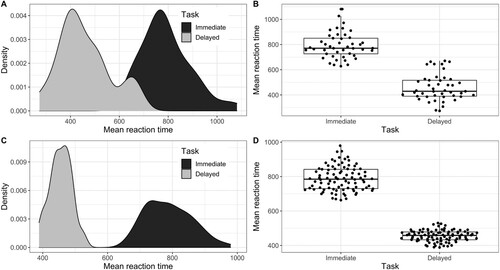
Figure 6. Results of mass univariate analysis for the comparison between the semantically related (SR) and unrelated (SU) trials for the stimulus-locked ERPs of slow participants (n = 23), with significant t-values before correction (top left); significant t-values after correction with TFCE (bottom left); mean amplitude at electrode PO8 (electrode where t-value is maximal) for the semantically related and unrelated trials, significant time points (after TFCE correction) underlined in purple, shading represents 95% confidence intervals (top right); Topographic map of t-values before correction at 250 ms (bottom right).
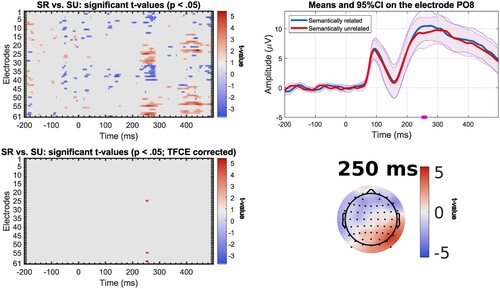
Figure 7. Results of mass univariate analysis for the comparison between the semantically related (SR) and unrelated (SU) trials for the stimulus-locked ERPs of fast participants (n = 22), with significant t-values before correction (top left); significant t-values after correction with TFCE (bottom left); mean amplitude at electrode CPz (electrode where t-value is maximal) for the semantically related and unrelated trials, significant time points (after TFCE correction) underlined in purple, shading represents 95% confidence intervals (top right); Topographic map of t-values before correction at selected time windows (bottom right).
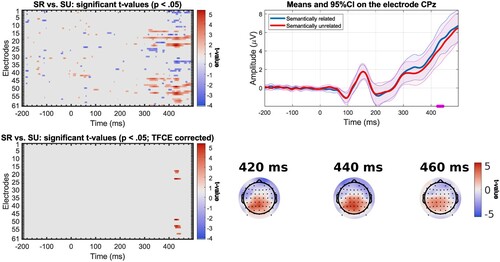
Figure 8. Results of mass univariate analysis for the comparison between semantically related (SR) and unrelated (SU) trials for the response-locked ERPs in slow participants (n = 23) with significant t-values before correction (top left); significant t-values after correction with TFCE (bottom left); mean amplitude at electrode AF7 (electrode where t-value is maximal) for the semantically related and unrelated trials, significant time points (after TFCE correction) underlined in purple, shading represents 95% confidence intervals (top right); Topographic map of t-values before correction at selected time points (bottom right).
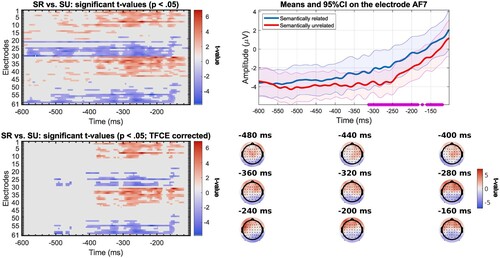
Figure 9. Results of mass univariate analysis for the comparison between semantically related (SR) and unrelated (SU) trials for the response-locked ERPs in fast participants (n = 22) with significant t-values before correction (top left); significant t-values after correction with TFCE (bottom left); mean amplitude at electrode F7 (electrode where t-value is maximal) for the semantically related and unrelated trials, significant time points (after TFCE correction) underlined in purple, shading represents 95% confidence intervals (top right); Topographic map of t-values before correction at selected time points (bottom right).
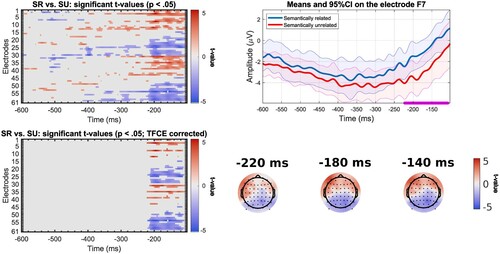
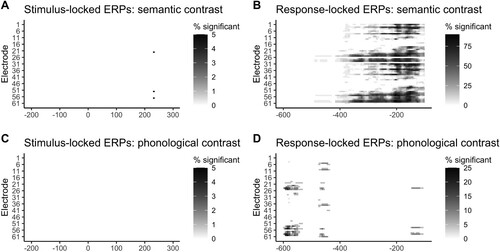
Figure 10. Results of mass univariate analyses for 20 random samples of 23 participants each. Note the difference in scales among plots. Plots display the percentage of time an electrode and time point are significant after TFCE correction on 23 participants (p < .05) for the A. stimulus-locked analysis for the semantic contrast, B. response-locked analysis for the semantic contrast, C. stimulus-locked analysis for the phonological contrast, and D. response-locked analysis for the phonological contrast.