
Figures & data
Table 1. Mean lexical decision reaction times (in ms; SDs in brackets) and response accuracy (in %, SDs in brackets) for 50 ms primes, in the classic (New et al., Citation2008) versus sandwich priming task (present Exp. 1) and for 66 ms primes, in the classic (New & Nazzi, Citation2014, Exp. 2) versus sandwich priming tasks (present Exp. 2–3).
Figure 1. Effect of consonant and vowel priming as a function of prime duration and paradigm type: 50 ms (classic vs. sandwich, Experiment 1) and 66 ms (classic vs. sandwich 33 ms pre-prime in Experiment 2 vs. sandwich 50 ms pre-prime in Experiment 3). Error bars indicate standard errors of the mean.
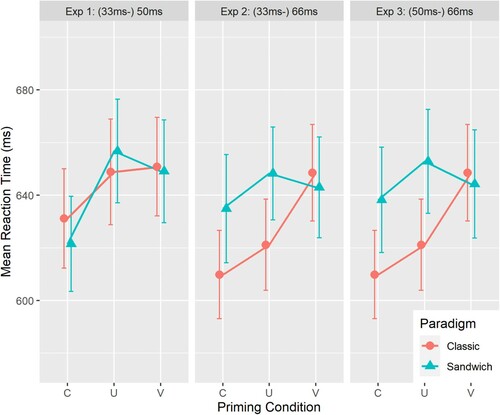
Table 2. Results of model 1 including Prime Type and Target Type as fixed factors (sandwich experiments). The R formula was: log10(RT) ∼ TypeCV * Prime + (1|Subject) + (1|Word).
Table 3. Results of model 2 including Prime Type and Paradigm Type as fixed factors (comparing classic and sandwich experiments). The R formula was: log10(RT) ∼ Prime * Experiment + (1|Subject) + (1|Word).