
Figures & data
Figure 1. Pitch contours (right panel) and spectrograms (left panel for music and middle panel for lexical tones) of the stimuli.
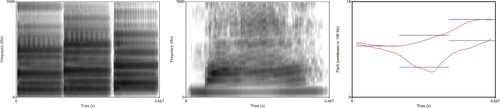
Figure 2. Electrodes used for artefact reduction for the infants.
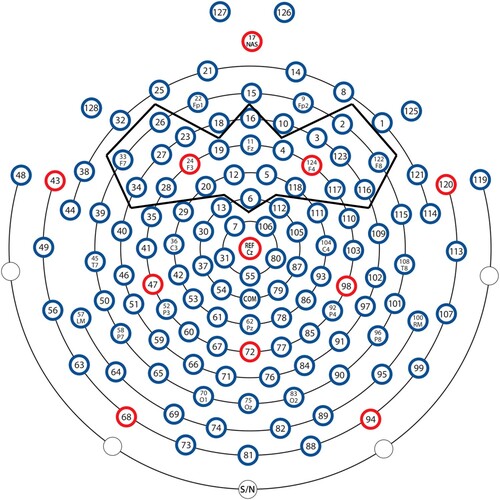
Table 1. Mean, standard deviation (SD), median and range of number of accepted trials in the lexical tone and the music conditions.
Figure 3. Standard and deviant ERPs and difference waves of the adult participants in the lexical tone and music conditions.
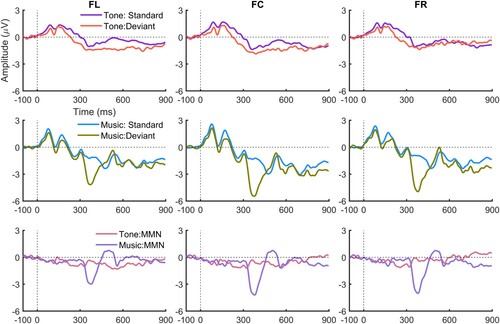
Table 2. For the adults, mean (SD) peak latencies (ms) and mean (SD) amplitudes (µv) of the MMNs and LDN in the music condition and the MMN in the lexical tone condition.
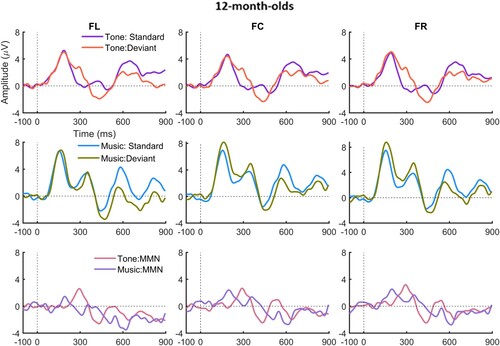
Table 3. For the infants, time windows (ms) in which the standard and deviant differed significantly from the stimulus onset at FL, FC and FR.
Table 4. Mismatch responses in 4-, 8-, and 12-month-old infants and adults.