
Figures & data
Table 1. Examples of stimulus material in the two sets and in the direct and indirect condition, respectively.
Table 2. Psycholinguistic properties of the critical replies (after exclusion of a few items, see material and methods section).
Table 3. Psycholinguistic properties defining the relationship between the critical replies and their context question (after exclusion of a few items, see Material and Methods section).
Table 4. Questions used to prompt the rating of each of the measured dimensions, together with their respective anchors.
Figure 1. Example of experimental procedure. The stimulus to rate is presented on the upper part of the screen (interrogative and affirmative simultaneously). In the lower part of the screen, the rating question and the Likert-scale are depicted. Subjects can select their ratings using the arrow keys and confirm it with the return key.
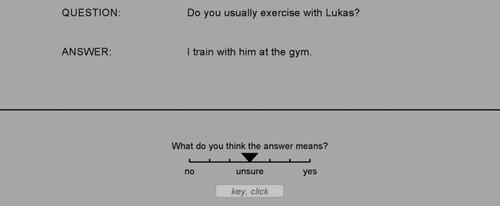
Table 5. For each of the ratings of certainty (CER-R), coherence (COH-R), directness (DIR-R), predictability (PRE-R) and semantic similarity to the question (SSI-R), the table provides information about the tested models, namely the Bayesian Information Criterion (BIC), the Akaike Information Criterion (AIC), and the log-likelihood (logLik).
Figure 2. Average ratings for the various dimensions: (A) Directness (DIR-R), (B) Coherence with the question (COH-R), (C) Predictability (PRE-R), (D) Semantic Similarity to the Question (SSI-R), (E) Certainty of Function (CER-R), (F) Function (FUN-R). Each of these are further divided by In/Directness (direct, indirect), SA-matching (SA-matched, non-SA-matched) and Polarity of the answer (yes, no). Error bars indicate the standard error of the mean based on single trial data.
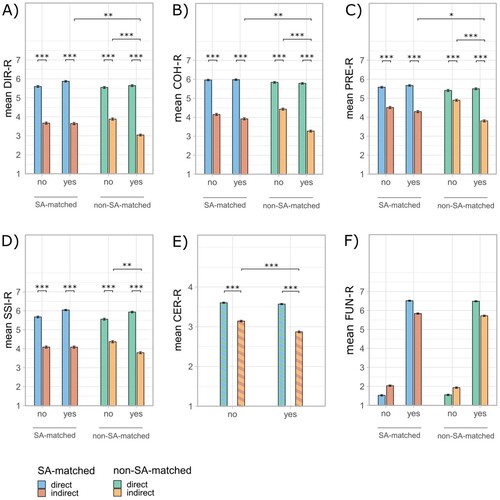
Figure 3. Correlation matrix shown for the following rated dimensions: certainty (CER-R), coherence with the question (COH-R), directness (DIR-R), predictability (PRE-R) and semantic similarity to the question (SSI-R). The plots below the diagonal show the scatter plot displaying the relationship between pairs of variables, together with the regression line in red. Each observation represents an item and its average score on a given scale. The plots above the diagonal show the respective Pearson correlation coefficient (R) and significance level after correction for multiple comparisons (*p < 0.05, **p < 0.01, ***p < 0.001).
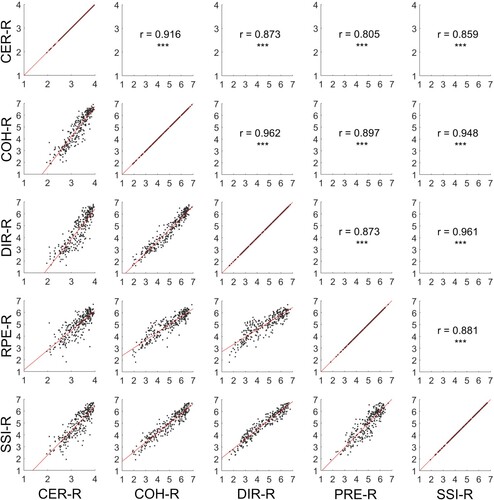
Figure 4. Scree plot depicting the Eigenvalues of each principal component identified by principal component analysis (PCA), together with the respective percentage of explained variance. The red dotted line represents Kaiser’s criterion at Eigenvalue 1.
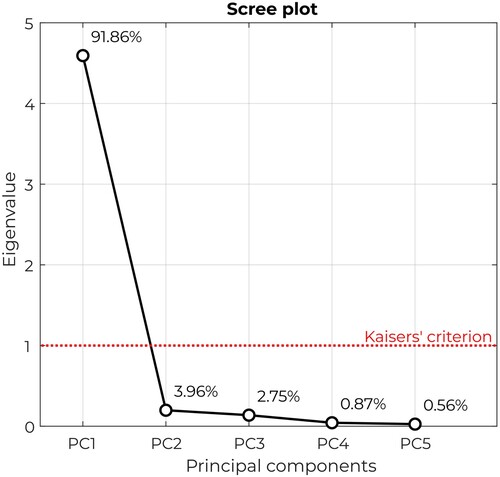
Table 7. (A) Output of the principal component analysis specifying Eigenvalues, percentage of explained variance and cumulative percentage of explained variance for each extracted principal component. (B) The rotated component matrix indicating the factor loads for PC1. PC2 is reported too for reference.
Table 6. Summary of the fixed and random effects of the best fitting model for each of the collected ratings of certainty (CER-R), coherence (COH-R), directness (DIR-R), predictability (PRE-R) and semantic similarity to the question (SSI-R).
Supplemental Appendix
Download MS Word (846.6 KB)Data Availability statement
The aggregated data that support the findings as well as stimulus material and task instructions are openly available on the Open Science Framework at https://osf.io/b9yeu/ or at https://doi.org/10.17605/OSF.IO/B9YEU.