Figures & data
Table 1. An example of coding a description.
Figure 1. Example gestures depicting (a) path only, (b) manner only, and (c) both path and manner. The full event descriptions are split into clauses (Cl.) and translations are given under each gesture example. The gesture stroke occurred during the underlined speech.
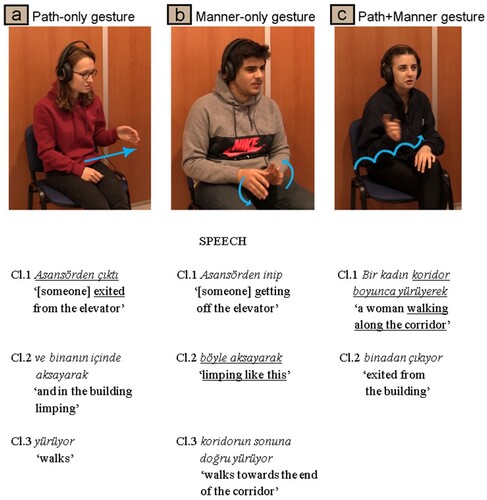
Table 2. The average number (M) of clauses and gestures across participants with standard deviations (SD, in parentheses).
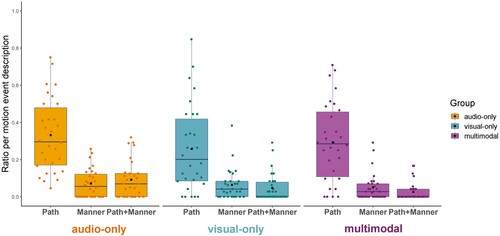
Figure 2. Ratio of motion event descriptions. Coloured dots represent the data for each participant. Black dots represent the group mean.

Figure 3. Path and manner in speech. Coloured dots represent the average data for each participant. Black dots represent the group mean.
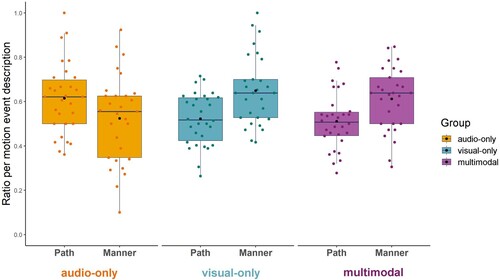
Figure 4. Ratio of gesture for motion event descriptions. Coloured dots represent the data for each participant. Black dots represent the group mean.
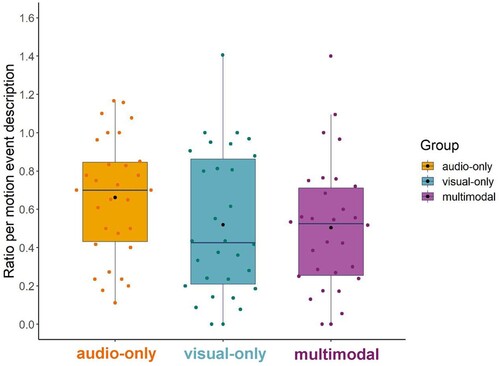
Figure 5. Path and manner gestures for motion event descriptions. Coloured dots represent the average data for each participant. Black dots represent the group mean.