
Figures & data
Figure 1. Event-related cortical activation and regions of interest (ROIs). (A) Spatial distribution of estimated activity, averaged across all conditions and subjects for the interval of 100–500 ms after the stimulus onset. The activity is visualised on the lateral view of averaged inflated cortical surfaces. The colour scale indicates the percentile of the activation magnitude among all source locations. (B) ROIs identified based on the estimated spatiotemporal patterns of activity. Colour coding indicates regions that in subsequent analyses showed reliable activation differences (green), successful decoding (yellow), or both (magenta, region L-STG1) across all reduplication pattern contrasts. The other regions (pale blue) showed neither activation differences nor decoding. Descriptive names and locations of the ROIs are given in Figure S1 and Table S1.
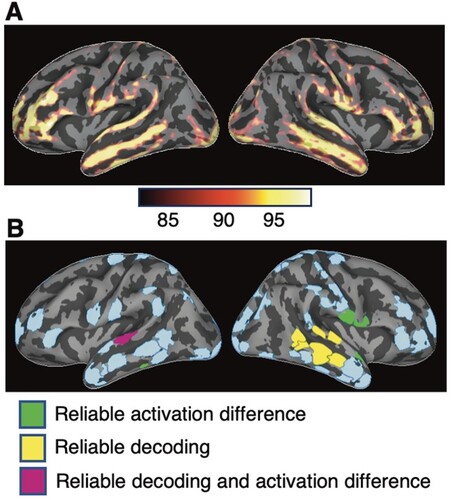
Figure 2. Time courses of pairwise activation contrasts and decoding accuracy between conditions with different reduplication patterns. (A) Activation differences (t-values) between the experimental conditions for all ROIs as a function of time. Dotted vertical lines indicate the onset time of a repeated syllable. The cortical lobes where the ROI resided are indicated by colours in the column at left; names of the ROIs can be found in Figure S2. (B) Pairwise decoding accuracy (t-values) between conditions. (C) Decoding accuracy (blue: %-correct; yellow: t-values) for the 8 ROIs that reliably supported decoding of reduplication contrasts, shown for the AAB versus ABB comparison. Shaded regions mark the results of cluster-based permutation test for statistically significant decoding accuracy across the subjects (p < 0.05).
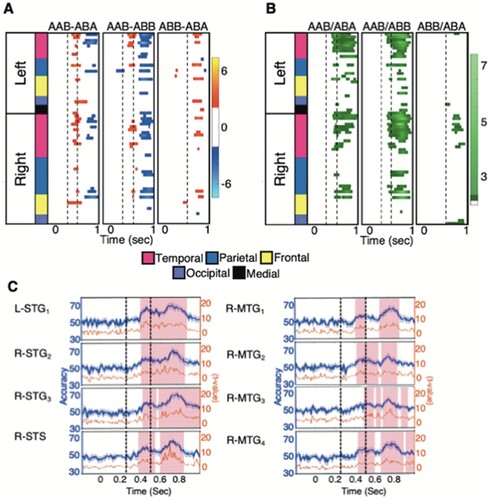
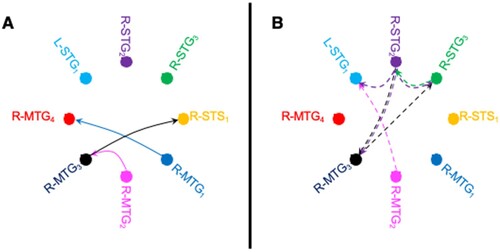
Figure 3. Cortical information flow associated with reduplication. Effective connectivity between the 8 ROIs that supported reliable decoding of reduplication contrasts in the interval of 100–250 ms after the onset of the second syllable in which reduplication of the second syllable (A) created stronger information flow (solid lines) or (B) weaker information flow (dashed lines). Line colour reflects the source of information flow. In both cases, only those connections are depicted that showed significant differences between conditions in both AAB-ABA and AAB-ABB contrasts, as measured by Granger causality analysis (p < 0.05, FDR-corrected).
Supplemental Material
Download MS Word (16.6 MB)Data availability statement
The authors confirm that the data supporting the findings of this study are available within the article [and/or] its supplementary materials by request from DWG. Code and documentation for our Granger Processing Stream (GPS) is available at https://www.nmr.mgh.harvard.edu/software/gps GPS relies on Freesurfer software for MRI analysis and automatic cortical parcellation (https://surfer.nmr.mgh.harvard.edu/) and MNE software for reconstruction of minimum norm estimates of source activity based on combined MRI, MEG and EEG data (https://pypi.org/project/mne/). Support vector machine code can be found at (www.csie.ntu.edu.tw/~cjlin/libsvm).