
Figures & data
Figure 1. Procedure of the experiment (figure from Augurzky et al., Citation2020).
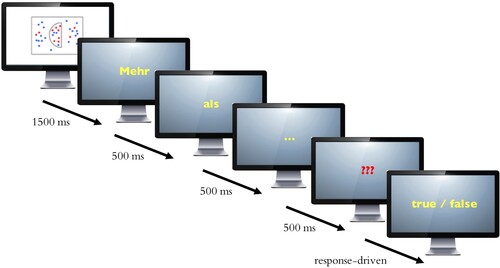
Figure 2. Mean reaction times for short sentences (fewer than half is abbreviated as FTH and more than half as MTH). The error bars represent within-participant SE.
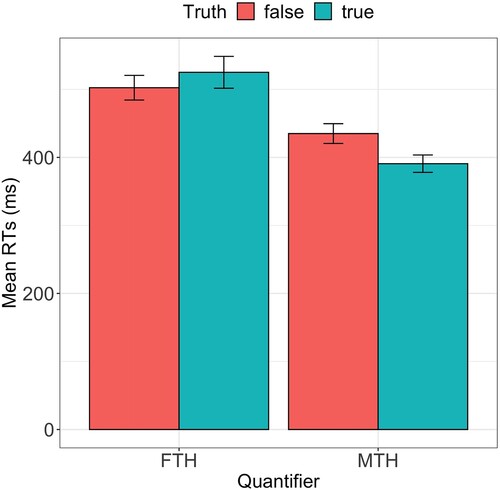
Figure 3. Bump topologies and stage durations for separate models more than half (MTH) and fewer than half (FTH) from quantifier onset. The values above bump topologies correspond to the average onset of the bump. The coloured bars indicate the stage durations. The values above the coloured bars show the mean stage durations. Additionally, the gray lines indicate the ERP analysis time windows from Augurzky et al. (Citation2020).
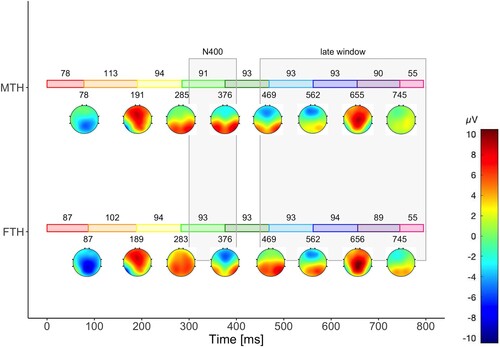
Figure 4. Bump topologies and stage durations for the combined model from quantifier onset plotted in each condition separately, more than half (MTH) and fewer than half (FTH). The coloured bars indicate the stage durations. The values above the coloured bars show the mean stage durations, and the values below the average onset of the bumps. Additionally, the gray lines indicate the ERP analysis time windows from Augurzky et al. (Citation2020).
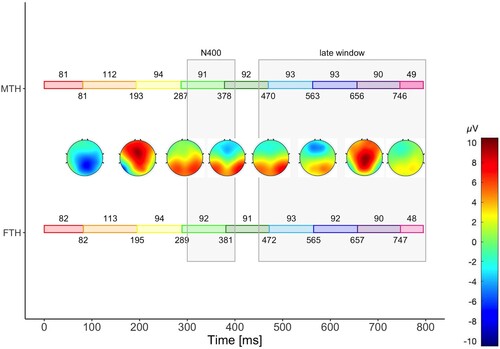
Figure 5. Bump topologies and stage durations for separate models more than half true sentence (MTH_t), more than half false sentence (MTH_f), fewer than half true sentence (FTH_t), and fewer than half false sentence (FTH_f) from adjective onset until the response. The values above bump topologies correspond to the average onset of the bump. The coloured bars indicate the stage durations. The values above the coloured bars show the mean stage durations. Additionally, the gray lines indicate the ERP analysis time windows from Augurzky et al. (Citation2020).
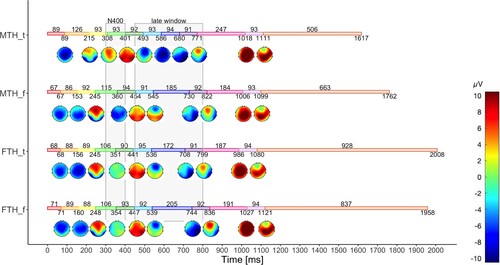
Figure 6. Bump topologies and stage durations for the combined model from adjective onset until the response plotted separately for each condition, more than half true sentence (MTH_t), more than half false sentence (MTH_f), fewer than half true sentence (FTH_t), and fewer than half false sentence (FTH_f). The timing is relative to adjective onset. The coloured bars indicate the stage durations. The values above the coloured bars show the mean stage durations, and the values below the average onset of the bumps. Additionally, the grey lines indicate the ERP analysis time windows from Augurzky et al. (Citation2020).
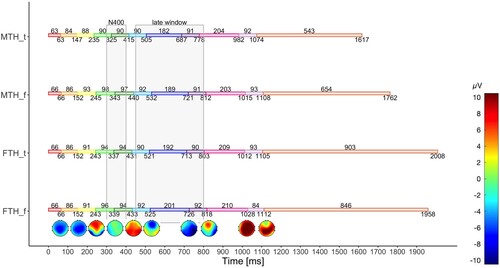
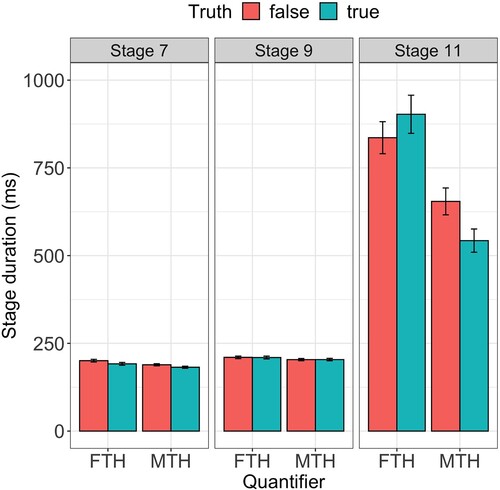
Figure 7. Mean durations of stages 7, 9, and 11. Fewer than half is abbreviated as FTH and more than half as MTH. The error bars represent within-participant SE.
Supplemental Material
Download PDF (6.5 MB)Data availability statement
The data are available at https://talar.sfb833.uni-tuebingen.de/erdora/cmdi/SFB833/B01/polarity_files.Analysis scripts are available at https://osf.io/6amgu/?view_only=d766908a62ef4f4cbe3c532adb5b7af2.