
Figures & data
Figure 1. Cognitive measures and models. (A) Phonological articulatory features are derived for the first and second phoneme of each word, specifying which of the 21 articulatory features apply to each sound. (B) The gating procedure used to define the candidates based on increasing segments of a spoken word, illustrated with the example of “eagle”. Early gates (e.g. 50 ms) generate several candidates beginning with the same onset sound and the candidate set decreases as more speech is heard. The point in time when a single candidate remains is considered the recognition point – indicated by the blue arrow. (C) Cohort entropy is calculated from the confidence values across candidates at a given gate, resulting in low entropy when participants are more certain of the word identity and high entropy when they are less certain. (D) A blended measure of the semantics of cohort members was calculated from a corpus-based distributional semantic vector for each candidate. The blended semantic vector is created by averaging the vectors of the candidate set for each word fragment.
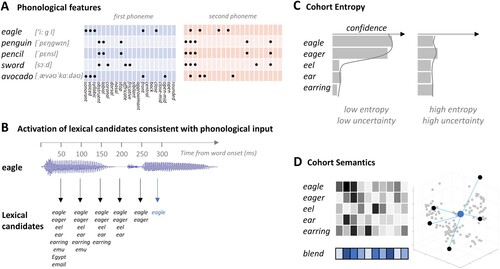
Figure 2. Spatiotemporal searchlight RSA results. (A) Significant model fit for the phonological, cohort entropy and cohort semantics RDMs individually, plotted for datapoints spaced at 25 ms intervals (vertex-wise p < 0.01, cluster p < 0.05). (B) Spatial extent of significant fits, collapsed over time, for phonology (blue), cohort entropy (cyan) and cohort semantics (green).
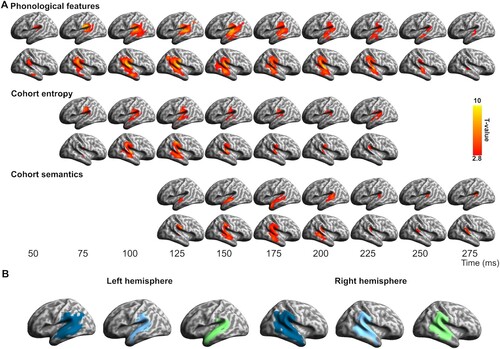
Figure 3. Spatial and temporal overlap of significant vertex-wise RSA model fit across models. (A) Spatial overlap of different model fits over the test epoch in core temporo-parietal regions, shown for data points spaced at 25 ms intervals. (B) Temporal distribution of vertices (sampled at 4 ms intervals) showing different types of model fit, including (i) overall model fit (unbroken lines) for phonology (dark blue), entropy (cyan) and semantics (green), (ii) vertices showing significant model fit to both entropy and phonetics (broken cyan line), (iii) vertices showing model fit to both semantics and phonetics (broken green line) and (iv) vertices showing fit to all three models at the same time (broken red line).
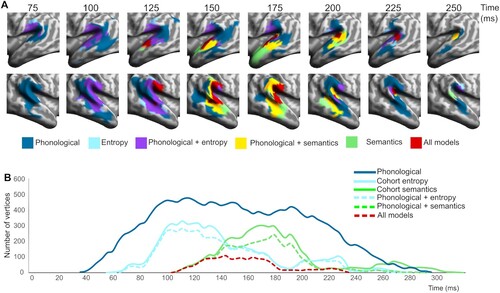
Figure 4. Spatial overlap in commonly activated vertices across model fits. (A) Overlap in spatial extent of significant fits for each model RDM, collapsed over time. (B) Percentage of vertices that show common effects for all three models, for two models or for a single model.
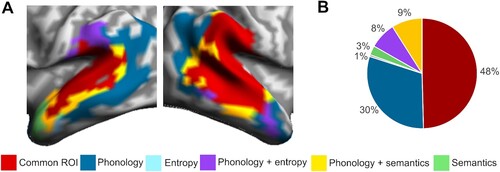
Figure 5. The temporal progression of effects within the common ROI. (A) Temporal distribution of vertices within the common ROI showing different types of model fit (sampled at 4 ms intervals). (B) Histograms of the onsets of model significance at each vertex within the common ROI. (C) Distributions of temporal delays between phonology and entropy model fits for each vertex and (D) Distributions of temporal delays between entropy and semantic model fits for each vertex.
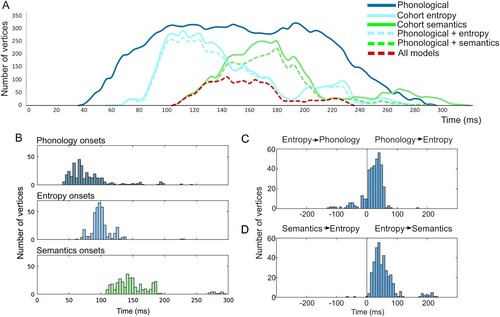
Figure 6. Spatiotemporal relationship of entropy and semantic model fits within the common ROI: Vertices that are initially significant to entropy only (blue) become either simultaneously significant to entropy and semantics (yellow) or become significant to semantics only (red).
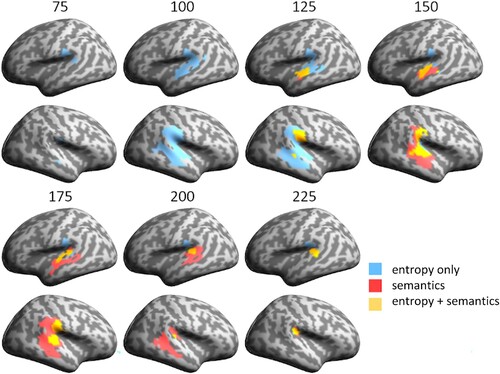
Table 1. Distribution of vertices across anatomical regions (AAL atlas). RSA model fit (in number of vertices and as a percentage of ROI total vertices) is shown for the common ROI and for each model separately. Total size (in vertices) of each AAL region is given in the left-hand column. AAL regions with model fits involving less than 10 vertices or less than 10% of ROI are not shown.