
Figures & data
Figure 1. Flow chart regarding participant selection.
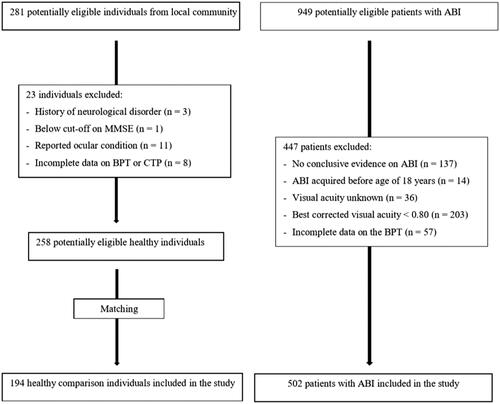
Table 1. Characteristics of participants.
Figure 2. The BPT (reduced size).
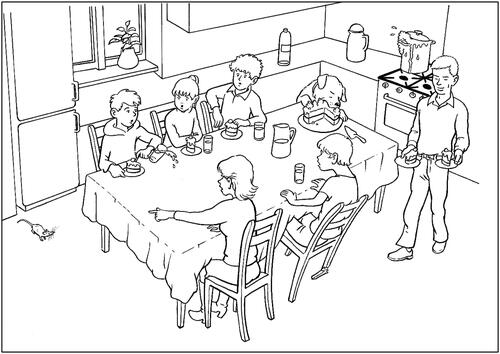
Figure 3. Distribution of scores on NoA-BPT for healthy individuals (n = 194) and patients with ABI (n = 502).
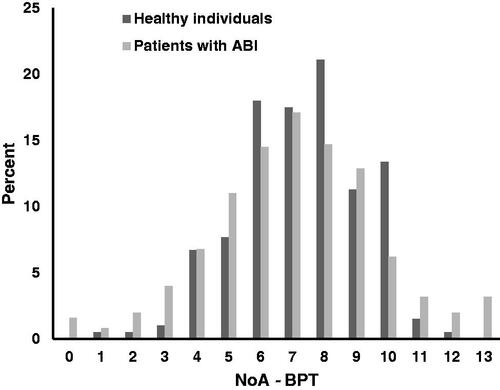
Table 2. Test performance of patients with ABI and healthy participants.
Table 3. Spearman correlation coefficients between the NoA-BPT and various descriptive and clinical characteristics of healthy individuals and patients with ABI.
Table 4. Patients with ABI with a NoA score below the cutoff on the BPT and likely having simultanagnosia based on clinical judgment.
Table 5. Characteristics of healthy controls (HC), patients with ABI unlikely having simultanagnosia (NoSim) and patients with ABI likely having simultanagnosia (Sim).
Table 6. Group comparisons between healthy controls (HC), patients with ABI unlikely having simultanagnosia (NoSim) and patients with ABI likely having simultanagnosia (Sim) with regard to their performance on the BPT.
Figure 4. Receiver operating characteristics curve indicating the correspondence between the BPT number of actions (NoA) and the assessor’s clinical judgment of patients with ABI likely (n = 28) and unlikely (n = 408) suffering from simultanagnosia.
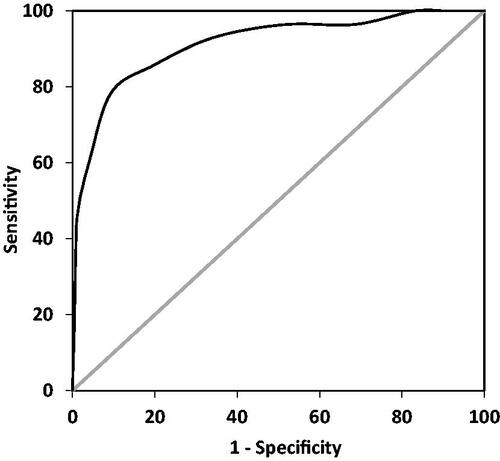
Table 7. Classification statistics for the identification of patients with likely simultanagnosia for various cutoffs of NoA on the BPT.