
Figures & data
Figure 1. Mean symptom reports for truth tellers (n = 32) and feigners (n = 32) across the 5-day period (Study 1). Error bars are 95% Confidence Intervals (CIs).
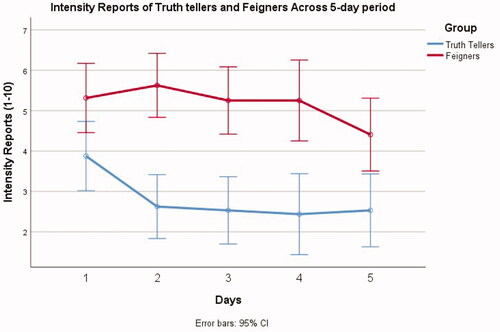
Table 1. Means and standard deviations of symptom intensity reports on all five days, with t-test results.
Table 2. SRSI subscales scores of Truth tellers and Feigners.
Figure 2. Mean symptom reports for truth tellers (n = 48) and feigners (n = 28) across the 5-day period (Study 2). Error bars are 95% CIs.
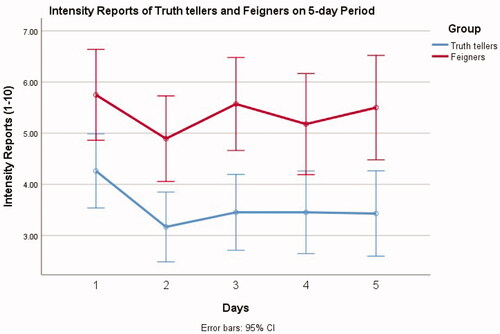
Table 3. Means and standard deviations of symptom intensity scores on all five days, including independent t-test results.
Table 4. Means of symptoms from SRSI subscales for both groups.
Figure 3. Mean symptom reports for truth tellers (n = 74) and feigners (n = 60) across the 5-day period (Study 1 & Study 2). Error bars are 95% CIs.
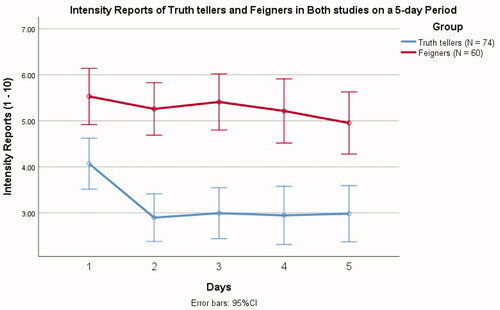
Table 5. Means of symptoms from SRSI subscales for both groups. One-way ANOVA results also displayed.