
Figures & data
FIGURE 1. Donor Funding for Global Vs. Country-specific Functions, Years 2013, 2015, and 2017.
Source: Ref. Citation3. © 2019 The Authors. All Rights Reserved.
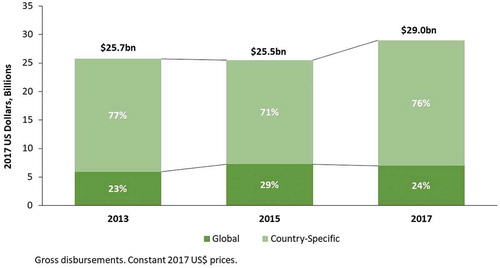
FIGURE 2. Donor Funding for Global Functions by Global Function Category, Years 2013, 2015, and 2017.
Source: Ref. Citation3. © 2019 The Authors. All Rights Reserved.
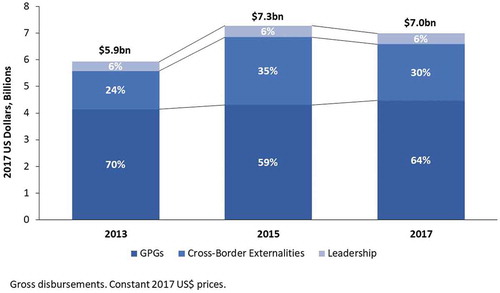
TABLE 1. How the Term “Common Goods for Health” Relates to the Term “Global Functions”
TABLE 2. Taxonomy of Global Functions
BOX 1. Estimating the Finance Gap for Product Development for Neglected Diseases
TABLE 3. Important or Game Changing Products Proposed by the Commission on Investing in Health that Could Help Achieve a Grand Convergence in Global Health by 2035. Source: CitationRef. 1.
BOX 2. The WHO’s Six Core Functions as Described in Its Thirteenth General Programme of Work 2019–2023Citation56
TABLE 4. WHO’s Sources of Financing (US Dollars). *derived from Charges against Voluntary Contributions. **approved for Current and past Bienna
TABLE 5. The Highest Priority Global Functions Requiring Investment, as Ranked by the CIH