Figures & data
Table 1. Descriptive statistics
Figure 1. Survival and health-adjusted survival by year: 2001, 2007 and 2016
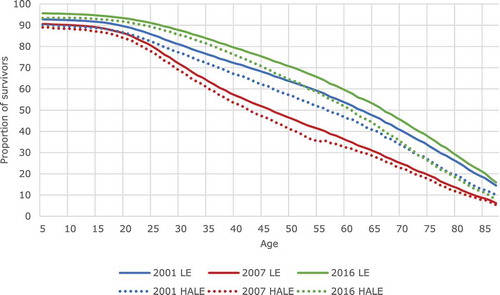
Figure 2. Life expectancy and healthy life expectancy at age 5 for the Black South African and non-Black population, 2001, 2007 and 2016
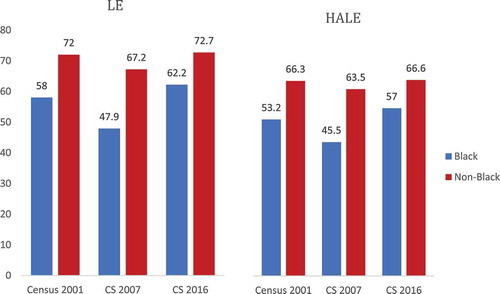
Figure 3. Racial gap in LE and HALE at age 5, 2001, 2007 and 2016
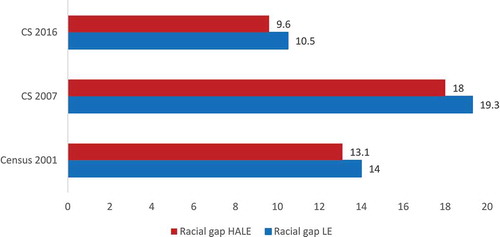
Figure 4a. Survival curves for the Black South African and non-Black population, 2001, 2007 and 2016
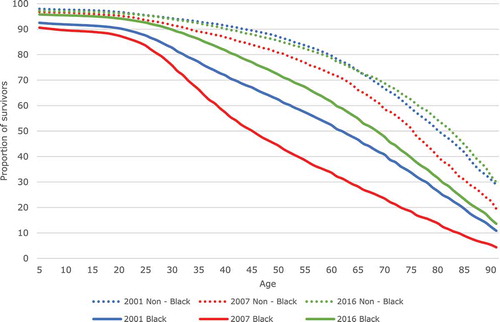
Figure 4b. Health-adjusted survival curves for the Black South African and non-Black population, 2001, 2007 and 2016
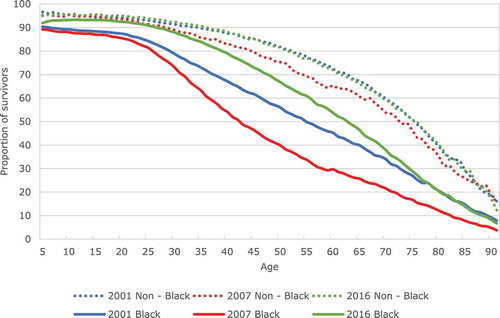
Figure 5a. Life expectancy at age 5, by income quintile and year
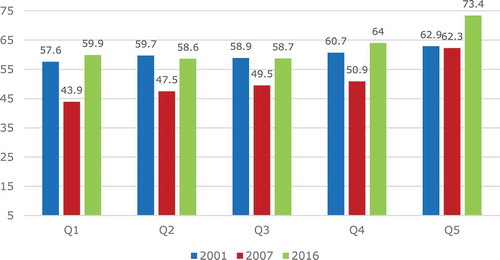
Figure 5b. HALE at age 5, by income quintile and year
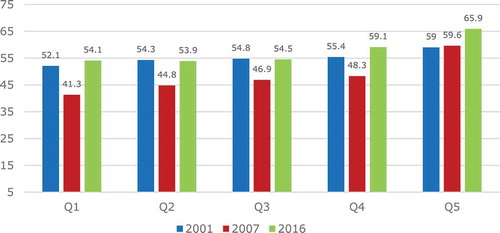
Table 2. Concentration indices (CI) for LE and HALE 20O1, 2007, and 2016
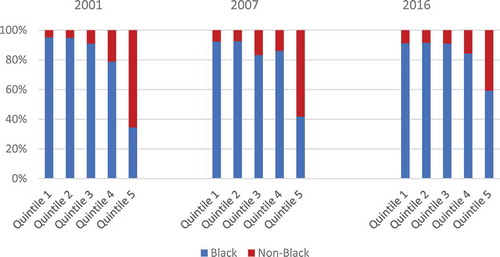
Figure 6. Population share (Black South African vs non-Black), by income quintile and year