
Figures & data
Figure 1. The construction of analytical samples for each country (see Materials and Methods for additional details). Of survey initiators, 32% (India), 46% (SA), and 54% (US) met the inclusion criteria. Eligible respondents were those currently using one of the specified HBC methods or using a non-HBC method. Of the eligible HBC users, those responding, “I would use hormonal birth control” were classified as H-receptive users, and of the eligible non-HBC users, those responding, “I don’t want to use any method of hormonal birth control” were classified as H-averse users.
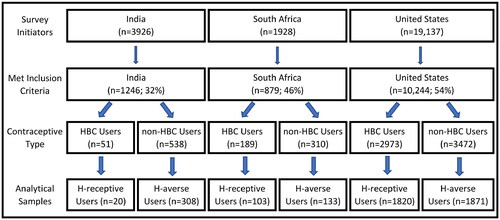
Table 1. Sociodemographic characteristics of US H-receptive and H-averse respondents.
Table 2. Sociodemographic characteristics of India H-receptive and H-averse respondents.
Table 3. Sociodemographic characteristics of SA H-receptive and H-averse respondents.
Table 4. India.
Table 5. South Africa.
Table 6. United States.
Table 7. Responses to the question, “Why did you choose the method you relied on most?” (select all that apply).
Figure 2. Intersections of the responses by US H-averse respondents (n = 1871) and US H-receptive respondents (n = 1817) to three prompts: A, “I don’t want to change my natural menstrual cycle”; B, “I wish I could take a break from having my period”; N, “How often would you like to have your period?”. Findings for prompt A depicted in headers at top, and for B and N in stacked bars (from left to right). (a) 70% (1305/1871) of H-averse respondents did not want to change their natural menstrual cycle; of these, 72% (946) wanted regular cycles (sum of green bars); of these, 30% (280/946, dark green bar) wanted to take a break from their cycle. The remaining 358 respondents who didn’t want to change their natural cycle (sum of yellow bars), wanted fewer periods; of these, 81% (291/358) wanted to take a break from their cycle (dark yellow bar). In total, 44% [(291+280)/1305] of H-averse respondents who did not want to change their natural menstrual cycle still wanted to take a break from their cycle. (b) 30% (566/1871) of H-averse users were not opposed to changing their cycles; of these, 67% (380/566) wanted fewer periods (sum of yellow bars); 74% (332+88 = 420, sum of dark yellow and dark green bars) wanted to take a break from their periods; 33% wanted regular periods (sum of green bars). (c) 22% (397/1817) of H-receptive users did not want to change their natural menstrual cycle; of these, 58% (230) wanted regular cycles (sum of green bars); 22% (87/397, dark green bar) wanted to take a break from their cycle. The remaining 167 respondents who didn’t want to change their natural cycle (sum of yellow bars) wanted fewer periods; of these, 82% (136/167) wanted to take a break from their cycle (dark yellow bar). In total, 56% [(136+87)/397] of H-receptive respondents who did not want to change their natural cycle still wanted to take a break from their cycle. (d) 78% (1420/1817) of H-receptive users were not opposed to changing their cycles; of these, 80% (1137/1420) wanted fewer periods (sum of yellow bars); 82% (1016+142 = 1158, sum of dark yellow and dark green bars) wanted to take a break from their periods); 20% wanted regular periods (sum of green bars).
![Figure 2. Intersections of the responses by US H-averse respondents (n = 1871) and US H-receptive respondents (n = 1817) to three prompts: A, “I don’t want to change my natural menstrual cycle”; B, “I wish I could take a break from having my period”; N, “How often would you like to have your period?”. Findings for prompt A depicted in headers at top, and for B and N in stacked bars (from left to right). (a) 70% (1305/1871) of H-averse respondents did not want to change their natural menstrual cycle; of these, 72% (946) wanted regular cycles (sum of green bars); of these, 30% (280/946, dark green bar) wanted to take a break from their cycle. The remaining 358 respondents who didn’t want to change their natural cycle (sum of yellow bars), wanted fewer periods; of these, 81% (291/358) wanted to take a break from their cycle (dark yellow bar). In total, 44% [(291+280)/1305] of H-averse respondents who did not want to change their natural menstrual cycle still wanted to take a break from their cycle. (b) 30% (566/1871) of H-averse users were not opposed to changing their cycles; of these, 67% (380/566) wanted fewer periods (sum of yellow bars); 74% (332+88 = 420, sum of dark yellow and dark green bars) wanted to take a break from their periods; 33% wanted regular periods (sum of green bars). (c) 22% (397/1817) of H-receptive users did not want to change their natural menstrual cycle; of these, 58% (230) wanted regular cycles (sum of green bars); 22% (87/397, dark green bar) wanted to take a break from their cycle. The remaining 167 respondents who didn’t want to change their natural cycle (sum of yellow bars) wanted fewer periods; of these, 82% (136/167) wanted to take a break from their cycle (dark yellow bar). In total, 56% [(136+87)/397] of H-receptive respondents who did not want to change their natural cycle still wanted to take a break from their cycle. (d) 78% (1420/1817) of H-receptive users were not opposed to changing their cycles; of these, 80% (1137/1420) wanted fewer periods (sum of yellow bars); 82% (1016+142 = 1158, sum of dark yellow and dark green bars) wanted to take a break from their periods); 20% wanted regular periods (sum of green bars).](/cms/asset/4d8df5a4-b779-4a7f-b54d-c32dcd178ef3/uwrh_a_2267533_f0002_c.jpg)