Figures & data
Figure 1. Ranking of sources for menstrual education. Stacked bar chart shows responses to the online survey question, “From which sources have you learned the most about periods?” Survey respondents were asked to rank up to the top five most important sources (1 = most important).
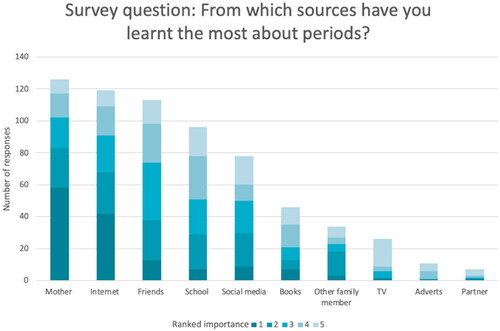
Figure 2. Persons responsible for providing education. Responses were to the online survey question: “Outside of science lessons, who provided the education on periods?” Survey respondents were asked to tick all that apply, and figures show the percentage of respondents who selected each answer option (e.g., 100% would represent that all this question’s respondents chose that option). “Health professional” includes school nurses, and “Brand” refers to educators from menstrual product companies.
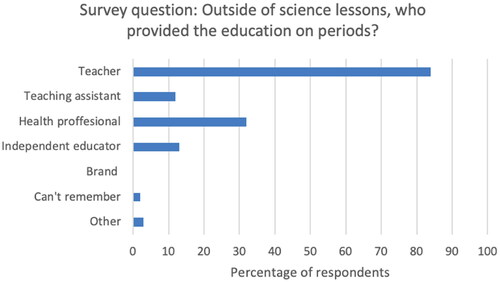
Figure 3. Health information covered in school. Responses are to the online survey question, “What health information was covered in your education about the menstrual cycle?” Participants were asked to tick all that applied, and figures show the percentage of respondents who selected each answer option (e.g., 100% would represent that all this question’s respondents chose that option).
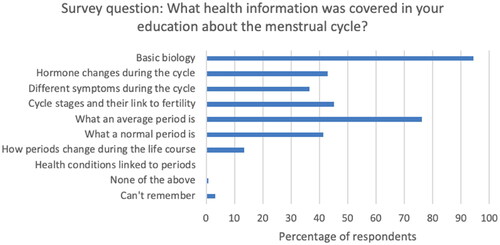
Figure 4. Practical information covered in school. Responses are to the online survey question, “What practical information was covered in your education about the menstrual cycle?” Survey respondents were asked to tick all that applied, and figures show the percentage of respondents who selected each answer option (e.g., 100% would represent that all this question’s respondents chose that option).
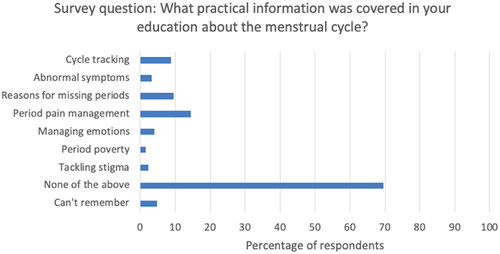
Figure 5. Menstrual product information covered in school. Responses are to the online survey question, “What were you taught about menstrual products?” Survey respondents were asked to tick all that applied, and figures show the percentage of respondents who selected each answer option (e.g., 100% would represent that all this question’s respondents chose that option).
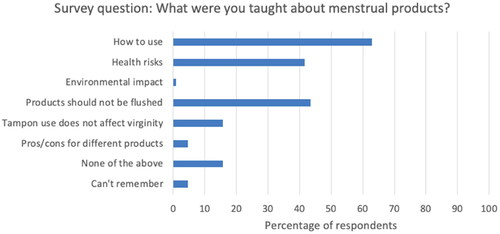
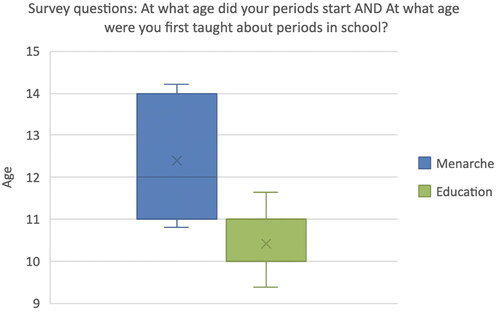
Figure 6. Timing of menarche and education. Box plot shows distribution of survey respondents’ age when menarche occurred and when they first received education about periods at school. Error bars (calculated to 1 standard deviation) are shown, and the “X” depicts the mean average for each dataset.