Figures & data
Table 1. Number and share of nanotech-related publications and patents with energy, agri-food, and water applications.
Figure 1. (A) Share of different sectors in pro-poor nanotechnology authorship by province; (B) Share of different sectors by field. Abbreviations for provinces are: ON: Ontario; QC: Quebec; BC: British Columbia; AB: Alberta; Abbreviations for sectors are: U: University; G: Government; I: Industry; H: Hospital.
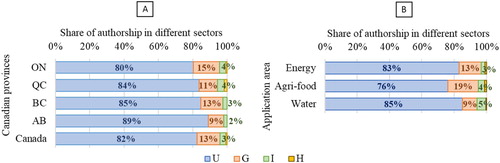
Figure 2. (A) Number of publications by province in pro-poor nanotechnology; (B) Average annual growth rate of publications in pro-poor nanotechnology.
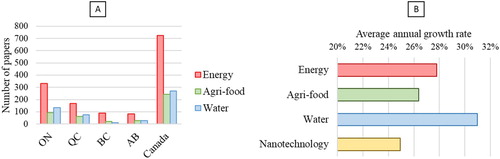
Figure 3. Number of articles and authors (left axis) and share of female authorship (right axis) over the years in pro-poor nanotechnology. Abbreviations for gender are: F: Female, M: Male.
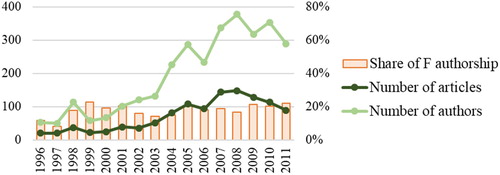
Figure 4. Share of female authorship (left axis) and citation and journal impact (right axis) of the papers published by female and male authors (A) by sector (B) by application area and (C) by province (***, **, * show significance of gender differences at the 1%, 5% and 10% levels: details can be found in the appendix (Tables A1–A3)).
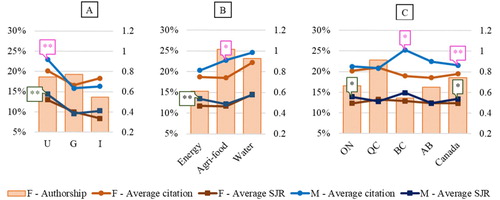
Figure 5. (A) Share of different sectors in pro-poor nanotechnology inventorship by province; (B) Share of different sectors by field.
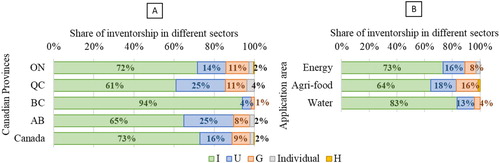
Figure 6. (A) Number of patents by province in pro-poor nanotechnology; (B) Average annual growth rate of patents in pro-poor nanotechnology.
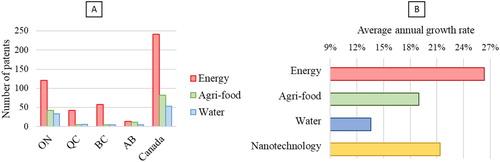
Figure 7. Number of patents and inventors (left axis) and share of female inventorship (right axis) over the years in pro-poor nanotechnology.
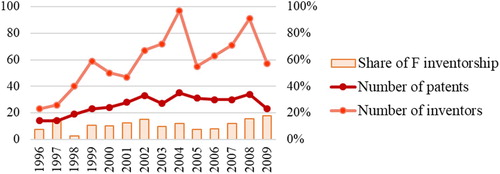
Figure 8. Share of female inventorship (as a percentage) and citation impact (as a decimal) (left axis) and average claims (right axis) of the patents granted to female and male inventors (A) by sector (B) by application area and (C) by province (***, **, * show significance of gender differences at the 1%, 5% and 10% levels: details can be found in the appendix (Tables A4-A6)).
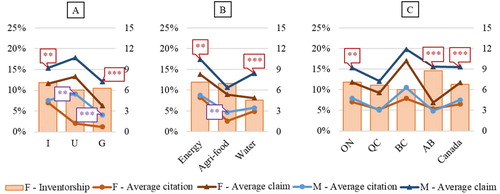
Figure 9. (A) Share of female A-Is authorship (left axis) and citation and journal impact of papers published by female and male A-Is (right axis); (B) Share of female A-Is inventorship (as a percentage) and citation impact (as a decimal) (left axis) and average claims (right axis) of the patents granted to female and male A-Is (***, **, * show significance of gender differences at the 1%, 5% and 10% levels: details can be found in the appendix (Table A7)).
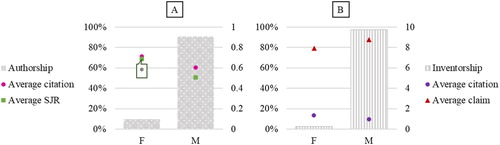
Figure 10. (A) Share of companies contributed to the scientific and technological development of pro-poor nanotechnology applications by industry; (B) Gender gap in employment and wage by different pro-poor applications.
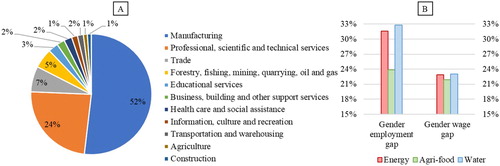
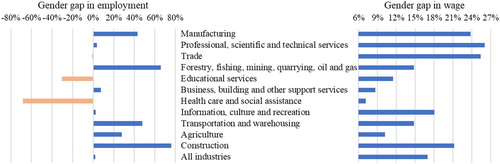
Figure 11. Gender gap in employment (left) and wage (right) in Canadian industries.