Figures & data
Table 1. List of the variables used in the data analysis.
Table 2. Descriptive information about the libraries in the analysis.
Table 3. List of the Codes and questions used in transcribing and coding of interviews with librarians.
Figure 1 This map shows the locations of US public libraries overlayed on a heat map showing median household income.
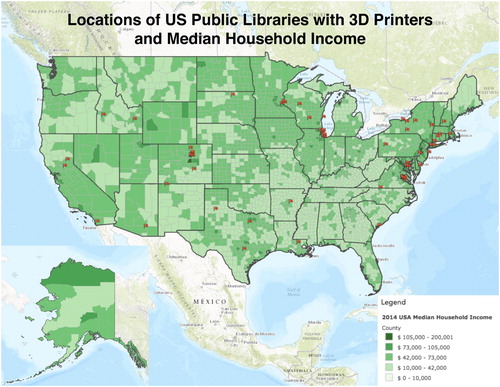
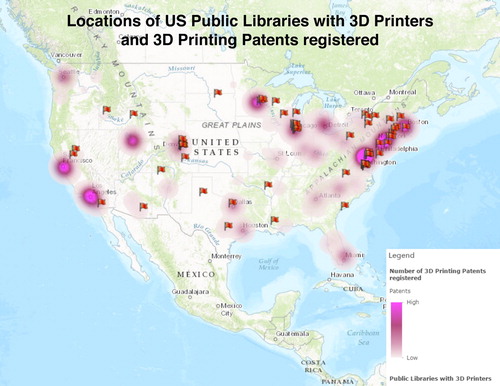
Figure 2 This map shows the locations of US public libraries with 3D printers overlayed on a heat map showing registered 3D printing patents in the US.