Figures & data
Figure 1. Optimal resource usage in innovation: the baseline case. Source: Authors’ own illustration based on Pindyck and Rubinfeld (Citation2009).
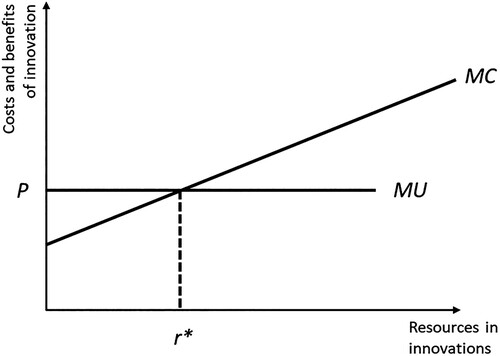
Figure 2. Positive external effects generated by the responsible innovation model. Source: Authors’ own illustration based on Pindyck and Rubinfeld (Citation2009).
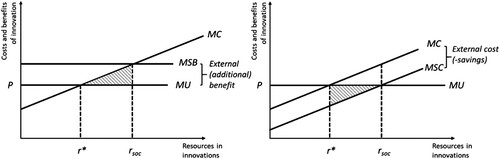
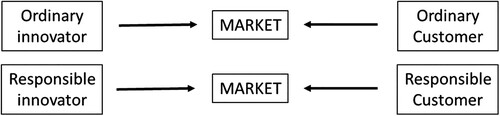
Figure 3. The market of an innovative product with homogeneous innovators and customers. Source: Authors’ own rendition.
Figure 4. Heterogeneous innovators and customers in the market of an innovative product: a pooling equilibrium. Source: Authors’ own rendition.
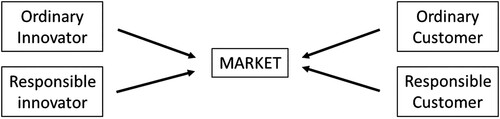
Figure 5. Separating equilibrium in the market of an innovative product. Source: Authors’ own rendition.